EN-CZ
Scientific papers
-
Recovery and resilience of European temperate forests after large and severe disturbances
https://www.researchgate.net/publication/378067978_Recovery_and_resilience_of_European_temperate_forests_after_large_and_severe_disturbancesCerioni, M., Brabec, M., Bače, R., Bāders, E., Bončina, A., Brůna, J., ... & Nagel, T. A. (2024). Recovery and resilience of European temperate forests after large and severe disturbances. Global Change Biology, 30(2), e17159.
-
Pathways and drivers of canopy accession across primary temperate forests of Europe
https://www.researchgate.net/publication/374497490_Pathways_and_drivers_of_canopy_accession_across_primary_temperate_forests_of_EuropePavlin, J., Nagel, T. A., Svitok, M., Di Filippo, A., Mikac, S., Keren, S., ... & Svoboda, M. (2024). Pathways and drivers of canopy accession across primary temperate forests of Europe. Science of The Total Environment, 906, 167593.
-
Protect old-growth forests in Europe now
https://www.researchgate.net/publication/370552463_Protect_old-growth_forests_in_Europe_nowMikolāš, M., Piovesan, G., Ahlström, A., Donato, D. C., Gloor, R., Hofmeister, J., ... & Kuemmerle, T. (2023). Protect old-growth forests in Europe now. Science, 380(6644), 466-466.
-
Shifts in intra-annual growth dynamics drive a decline in productivity of temperate trees in Central European forest under warmer climate
https://www.researchgate.net/publication/373762417_Shifts_in_intra-annual_growth_dynamics_drive_a_decline_in_productivity_of_temperate_trees_in_Central_European_forest_under_warmer_climateMatula, R., Knířová, S., Vítámvás, J., Šrámek, M., Kníř, T., Ulbrichová, I., ... & Plichta, R. (2023). Shifts in intra-annual growth dynamics drive a decline in productivity of temperate trees in Central European forest under warmer climate. Science of The Total Environment, 166906.
-
Spruce-and beech-dominated primary forests in the western carpathians differ in terms of forest structure and bird assemblages, independently of disturbance regimes
https://www.researchgate.net/publication/372057319_Spruce-_and_beech-dominated_primary_forests_in_the_western_Carpathians_differ_in_terms_of_forest_structure_and_bird_assemblages_independently_of_disturbance_regimesKameniar, O., Baláž, M., Svitok, M., Mikoláš, M., Ferenčík, M., Frankovič, M., ... & Svoboda, M. (2023). Spruce-and beech-dominated primary forests in the western carpathians differ in terms of forest structure and bird assemblages, independently of disturbance regimes. European Journal of Environmental Sciences, 13(1), 47-59.
-
Old-growth forests with long continuity are essential for preserving rare wood-inhabiting fungi
https://www.researchgate.net/publication/368903008_Old-growth_forests_with_long_continuity_are_essential_for_preserving_rare_wood-inhabiting_fungiMajdanová, L., Hofmeister, J., Pouska, V., Mikoláš, M., Zíbarová, L., Vítková, L., ... & Čada, V. (2023). Old-growth forests with long continuity are essential for preserving rare wood-inhabiting fungi. Forest Ecology and Management, 541, 121055.
-
Temperate Primary Forest Biomass Accumulates over Centuries-Long Time Frames
https://www.researchgate.net/publication/371505439_Temperate_Primary_Forest_Biomass_Accumulates_over_Centuries-Long_Time_FramesRalhan, D., Keith, H., Pavlin, J., Stegehuis, A. I., Marchand, W., Fruleux, A., ... & Svoboda, M. (2023). Temperate Primary Forest Biomass Accumulates over Centuries-Long Time Frames. Ecosystems, 1-18.
-
Synchronised disturbances in spruce-and beech-dominated forests across the largest primary mountain forest landscape in temperate Europe
https://www.researchgate.net/publication/369742424_Synchronised_disturbances_in_spruce-_and_beech-dominated_forests_across_the_largest_primary_mountain_forest_landscape_in_temperate_EuropeKameniar, O., Vostarek, O., Mikoláš, M., Svitok, M., Frankovič, M., Morrissey, R. C., ... & Svoboda, M. (2023). Synchronised disturbances in spruce-and beech-dominated forests across the largest primary mountain forest landscape in temperate Europe. Forest Ecology and Management, 537, 120906.
-
Protect old-growth forests in Europe now
https://www.researchgate.net/publication/370552463_Protect_old-growth_forests_in_Europe_nowMikolāš, M., Piovesan, G., Ahlström, A., Donato, D. C., Gloor, R., Hofmeister, J., ... & Kuemmerle, T. (2023). Protect old-growth forests in Europe now. Science, 380(6644), 466-466.
-
Response of habitat quality to mixed severity disturbance regime in Norway spruce forests
https://www.researchgate.net/publication/369728092_Response_of_habitat_quality_to_mixed_severity_disturbance_regime_in_Norway_spruce_forests?_sg=Ak3XfYjoIKWtIf7w5qP6IH-4f4H3b85sVnHjSYv1OR6v6HXLdxVOxHcJ_o2cmkowTizpn_cRVL1gcCABace, R., Hofmeister, J., Vitkova, L., Brabec, M., Begovic, K., Cada, V., ... & Svoboda, M. (2023). Response of habitat quality to mixed severity disturbance regime in Norway spruce forests. Journal of Applied Ecology.
-
Natural Disturbances are Essential Determinants of Tree-Related Microhabitat Availability in Temperate Forests
https://www.researchgate.net/publication/369553637_Natural_Disturbances_are_Essential_Determinants_of_Tree-Related_Microhabitat_Availability_in_Temperate_ForestsZemlerová, V., Kozák, D., Mikoláš, M., Svitok, M., Bače, R., Smyčková, M., ... & Svoboda, M. (2023). Natural Disturbances are Essential Determinants of Tree-Related Microhabitat Availability in Temperate Forests. Ecosystems, 1-15.
-
The mixed severity disturbance regime of primary beech-dominated forests and its trends of 200 years development
https://meetingorganizer.copernicus.org/EGU23/EGU23-3377.htmlJanda, P., Svitok, M., Vostárek, O., Mikoláš, M., Bače, R., Čada, V., ... & Svoboda, M. (2023). The mixed severity disturbance regime of primary beech-dominated forests and its trends of 200 years development (No. EGU23-3377). Copernicus Meetings.
-
Importance of conserving large and old trees to continuity of tree‐related microhabitats
https://www.researchgate.net/publication/368357825_Importance_of_conserving_large_and_old_trees_to_continuity_of_tree-related_microhabitatsKozák, D., Svitok, M., Zemlerová, V., Mikoláš, M., Lachat, T., Larrieu, L., ... & Svoboda, M. (2023). Importance of conserving large and old trees to continuity of tree‐related microhabitats. Conservation Biology.
-
Accelerated growth rates of Norway spruce and European beech saplings from Europe's temperate primary forests are related to warmer conditions
https://www.researchgate.net/publication/366372504_Accelerated_growth_rates_of_Norway_spruce_and_European_beech_saplings_from_Europe%27s_temperate_primary_forests_are_related_to_warmer_conditionMarchand, W., Buechling, A., Rydval, M., Čada, V., Stegehuis, A. I., Fruleux, A., ... & Svoboda, M. (2023). Accelerated growth rates of Norway spruce and European beech saplings from Europe's temperate primary forests are related to warmer conditions. Agricultural and Forest Meteorology, 329, 109280.
-
Impact of disturbance signatures on tree-ring width and blue intensity chronology structure and climatic signals in Carpathian Norway spruce
https://www.researchgate.net/publication/365152200_Impact_of_disturbance_signatures_on_tree-ring_width_and_blue_intensity_chronology_structure_and_climatic_signals_in_Carpathian_Norway_spruceJiang, Y., Begović, K., Nogueira, J., Schurman, J. S., Svoboda, M., & Rydval, M. (2022). Impact of disturbance signatures on tree-ring width and blue intensity chronology structure and climatic signals in Carpathian Norway spruce. Agricultural and Forest Meteorology, 327, 109236.
-
Ecological and methodological drivers of non-stationarity in tree growth response to climate
https://www.researchgate.net/publication/364202935_Ecological_and_methodological_drivers_of_non-stationarity_in_tree_growth_response_to_climateTumajer, J., Begović, K., Čada, V., Jenicek, M., Lange, J., Mašek, J., ... & Treml, V. (2022). Ecological and methodological drivers of non‐stationarity in tree growth response to climate. Global Change Biology.
-
Large old trees increase growth under shifting climatic constraints: Aligning tree longevity and individual growth dynamics in primary mountain spruce forests
https://www.researchgate.net/publication/364065140_Large_old_trees_increase_growth_under_shifting_climatic_constraints_aligning_tree_longevity_and_individual_growth_dynamics_in_primary_mountain_spruce_forestsBegović, K., Schurman, J. S., Svitok, M., Pavlin, J., Langbehn, T., Svobodová, K., ... & Svoboda, M. (2022). Large old trees increase growth under shifting climatic constraints: aligning tree longevity and individual growth dynamics in primary mountain spruce forests. Global Change Biology.
-
Spatial and temporal extents of natural disturbances differentiate deadwood-inhabiting fungal communities in spruce primary forest ecosystems
https://www.researchgate.net/publication/360484482_Spatial_and_temporal_extents_of_natural_disturbances_differentiate_deadwood-inhabiting_fungal_communities_in_spruce_primary_forest_ecosystemsFerenčík, M., Svitok, M., Mikoláš, M., Hofmeister, J., Majdanová, L., Vostarek, O., ... & Svoboda, M. (2022). Spatial and temporal extents of natural disturbances differentiate deadwood-inhabiting fungal communities in spruce primary forest ecosystems. Forest Ecology and Management, 517, 120272.
-
2022 Key factors determining the presence of Tree-related Microhabitats: A synthesis of potential factors at site, stand and tree scales, with perspectives for further research
https://www.researchgate.net/publication/360129730_Key_factors_determining_the_presence_of_Tree-related_Microhabitats_A_synthesis_of_potential_factors_at_site_stand_and_tree_scales_with_perspectives_for_further_researchLarrieu, L., Courbaud, B., Drénou, C., Goulard, M., Bütler, R., Kozák, D., ... & Vandekerkhove, K. (2022). Key factors determining the presence of Tree-related Microhabitats: A synthesis of potential factors at site, stand and tree scales, with perspectives for further research. Forest Ecology and Management, 515, 120235.
-
Tree-Related Microhabitats Follow Similar Patterns but are More Diverse in Primary Compared to Managed Temperate Mountain Forests
https://www.researchgate.net/publication/353832131_Tree-Related_Microhabitats_Follow_Similar_Patterns_but_are_More_Diverse_in_Primary_Compared_to_Managed_Temperate_Mountain_ForestsAsbeck, T., Kozak, D., Spinu, A. P., Mikoláš, M., Zemlerova, V., & Svoboda, M. (2022). Tree-Related Microhabitats Follow Similar Patterns but are More Diverse in Primary Compared to Managed Temperate Mountain Forests. Ecosystems, 25(3), 712-726.
-
Natural disturbance regimes as a guide for sustainable forest management in Europe
https://www.researchgate.net/publication/359505057_Natural_disturbance_regimes_as_a_guide_for_sustainable_forest_management_in_EuropeAszalós, R., Thom, D., Aakala, T., Angelstam, P., Brūmelis, G., Gálhidy, L., ... & Keeton, W. S. (2022). Natural disturbance regimes as a guide for sustainable forest management in Europe. Ecological Applications, e2596.
-
Climate-change-driven growth decline of European beech forests
https://www.researchgate.net/publication/359150216_Climate-change-driven_growth_decline_of_European_beech_forestsMartinez del Castillo, E., Zang, C. S., Buras, A., Hacket Pain, A., Esper, J., Serrano-Notivoli, R., ... & de Luis, M. (2022). Climate-change-driven growth decline of European beech forests. Communications Biology.
-
Historical mixed-severity disturbances shape current diameter distributions of primary temperate Norway spruce mountain forests in Europe
https://www.researchgate.net/publication/355540728_Historical_mixed-severity_disturbances_shape_current_diameter_distributions_of_primary_temperate_Norway_spruce_mountain_forests_in_EuropeRodrigo, R., Pettit, J. L., Matula, R., Kozák, D., Bače, R., Pavlin, J., ... & Svoboda, M. (2022). Historical mixed-severity disturbances shape current diameter distributions of primary temperate Norway spruce mountain forests in Europe. Forest Ecology and Management, 503, 119772.
-
Trends in climatically driven extreme growth reductions of Picea abies and Pinus sylvestris in Central Europe
https://www.researchgate.net/publication/355114236_Trends_in_climatically-driven_extreme_growth_reductions_of_Picea_abies_and_Pinus_sylvestris_in_Central_EuropeTreml, V., Mašek, J., Tumajer, J., Rydval, M., Čada, V., Ledvinka, O., & Svoboda, M. (2022). Trends in climatically driven extreme growth reductions of Picea abies and Pinus sylvestris in Central Europe. Global Change Biology, 28(2), 557-570.
-
Factors influencing the rate of formation of tree‐related microhabitats and implications for biodiversity conservation and forest management
https://www.researchgate.net/publication/355681530_Factors_influencing_the_rate_of_formation_of_tree-related_microhabitats_and_implications_for_biodiversity_conservation_and_forest_managementCourbaud, B., Larrieu, L., Kozak, D., Kraus, D., Lachat, T., Ladet, S., ... & Zudin, S. (2021). Factors influencing the rate of formation of tree‐related microhabitats and implications for biodiversity conservation and forest management. Journal of Applied Ecology.
-
The impact of natural disturbance dynamics on lichen diversity and composition in primary mountain spruce forests
https://www.researchgate.net/publication/355159500_The_impact_of_natural_disturbance_dynamics_on_lichen_diversity_and_composition_in_primary_mountain_spruce_forestsLangbehn, T., Hofmeister, J., Svitok, M., Mikoláš, M., Matula, R., Halda, J., ... & Svoboda, M. (2021). The impact of natural disturbance dynamics on lichen diversity and composition in primary mountain spruce forests. Journal of Vegetation Science, e13087.
-
Historical mixed-severity disturbances shape current diameter distributions of primary temperate Norway spruce mountain forests in Europe
https://www.researchgate.net/publication/355540728_Historical_mixed-severity_disturbances_shape_current_diameter_distributions_of_primary_temperate_Norway_spruce_mountain_forests_in_EuropeRodrigo, R., Pettit, J. L., Matula, R., Kozák, D., Bače, R., Pavlin, J., ... & Svoboda, M. (2022). Historical mixed-severity disturbances shape current diameter distributions of primary temperate Norway spruce mountain forests in Europe. Forest Ecology and Management, 503, 119772.
-
Natural disturbance impacts on trade-offs and co-benefits of forest biodiversity and carbon
https://www.researchgate.net/publication/355439312_Natural_disturbance_impacts_on_trade-offs_and_co-benefits_of_forest_biodiversity_and_carbonMikoláš, M., Svitok, M., Bače, R., Meigs, G. W., Keeton, W. S., Keith, H., ... & Svoboda, M. (2021). Natural disturbance impacts on trade-offs and co-benefits of forest biodiversity and carbon. Proceedings of the Royal Society B, 288(1961), 20211631.
-
Trends in climatically‐driven extreme growth reductions of Picea abies and Pinus sylvestris in Central Europe
https://www.researchgate.net/publication/355114236_Trends_in_climatically-driven_extreme_growth_reductions_of_Picea_abies_and_Pinus_sylvestris_in_Central_EuropeTreml, V., Mašek, J., Tumajer, J., Rydval, M., Čada, V., Ledvinka, O., & Svoboda, M. (2021). Trends in climatically‐driven extreme growth reductions of Picea abies and Pinus sylvestris in Central Europe. Global Change Biology.
-
Disturbance history is a key driver of tree life span in temperate primary forests
https://www.researchgate.net/publication/353711013_Disturbance_history_is_a_key_driver_of_tree_lifespan_in_temperate_primary_forestsPavlin, J., Nagel, T. A., Svitok, M., Pettit, J. L., Begović, K., Mikac, S., ... & Svoboda, M. (2021). Disturbance history is a key driver of tree life span in temperate primary forests. Journal of Vegetation Science, 32(5), e13069.
-
Tree-Related Microhabitats Follow Similar Patterns but are More Diverse in Primary Compared to Managed Temperate Mountain Forests
https://www.researchgate.net/publication/353832131_Tree-Related_Microhabitats_Follow_Similar_Patterns_but_are_More_Diverse_in_Primary_Compared_to_Managed_Temperate_Mountain_ForestsAsbeck, T., Kozák, D., Spînu, A. P., Mikoláš, M., Zemlerová, V., & Svoboda, M. (2021). Tree-Related Microhabitats Follow Similar Patterns but are More Diverse in Primary Compared to Managed Temperate Mountain Forests. Ecosystems, 1-15.
-
Co-occurrence patterns of tree-related microhabitats: A method to simplify routine monitoring
https://www.researchgate.net/publication/351283902_Co-occurrence_patterns_of_tree-related_microhabitats_A_method_to_simplify_routine_monitoringLarrieu, L., Cabanettes, A., Courbaud, B., Goulard, M., Heintz, W., Kozák, D., ... & Svoboda, M. (2021). Co-occurrence patterns of tree-related microhabitats: A method to simplify routine monitoring. Ecological Indicators, 127, 107757.
-
Both Cyclone‐induced and convective storms drive disturbance patterns in European primary beech forests
https://www.researchgate.net/publication/350217521_Both_Cyclone-induced_and_Convective_Storms_Drive_Disturbance_Patterns_in_European_Primary_Beech_ForestsPettit, J. L., Pettit, J. M., Janda, P., Rydval, M., Čada, V., Schurman, J. S., ... & Svoboda, M. (2021). Both Cyclone‐induced and convective storms drive disturbance patterns in European primary beech forests. Journal of Geophysical Research: Atmospheres, 126(7), e2020JD033929.
-
A tale of two species: climate-competition tradeoffs shape range limits according to tree life-history strategies
https://www.researchgate.net/publication/349164758_A_tale_of_two_species_climate-competition_tradeoffs_shape_range_limits_according_to_tree_life-history_strategiesSchurman, J., Janda, P., Rydval, M., Mikolas, M., Svoboda, M., & Babst, F. (2021). A tale of two species: climate-competition tradeoffs shape range limits according to tree life-history strategies. Authorea Preprints.
-
Historical natural disturbances shape spruce primary forest structure and indirectly influence bird assemblage composition
https://www.researchgate.net/publication/345161863_Historical_natural_disturbances_shape_spruce_primary_forest_structure_and_indirectly_influence_bird_assemblage_compositionKameniar, O., Baláž, M., Svitok, M., Reif, J., Mikoláš, M., Pettit, J. L., ... & Svoboda, M. (2021). Historical natural disturbances shape spruce primary forest structure and indirectly influence bird assemblage composition. Forest Ecology and Management, 481, 118647.
-
Natural dynamics of temperate mountain beech-dominated primary forests in Central Europe
https://www.researchgate.net/publication/345161743_Natural_dynamics_of_temperate_mountain_beech-dominated_primary_forests_in_Central_EuropeFrankovič, M., Janda, P., Mikoláš, M., Čada, V., Kozák, D., Pettit, J. L., ... & Gloor, R. Natural dynamics of temperate mountain beech-dominated primary forests in Central Europe. Forest Ecology and Management, 479, 118522.
-
Moderate-to High-Severity Disturbances Shaped the Structure of Primary Picea Abies (L.) Karst. Forest in the Southern Carpathians
https://www.researchgate.net/publication/347752187_Moderate-to_High-Severity_Disturbances_Shaped_the_Structure_of_Primary_Picea_Abies_L_Karst_Forest_in_the_Southern_CarpathiansSpînu, A. P., Petrițan, I. C., Mikoláš, M., Janda, P., Vostarek, O., Čada, V., & Svoboda, M. (2020). Moderate-to High-Severity Disturbances Shaped the Structure of Primary Picea Abies (L.) Karst. Forest in the Southern Carpathians. Forests, 11(12), 1315.
-
Protection gaps and restoration opportunities for primary forests in Europe
https://www.researchgate.net/publication/344265899_Protection_gaps_and_restoration_opportunities_for_primary_forests_in_EuropeSabatini, F. M., Keeton, W. S., Lindner, M., Svoboda, M., Verkerk, P. J., Bauhus, J., ... & Garbarino, M. (2020). Protection gaps and restoration opportunities for primary forests in Europe. Diversity and Distributions.
-
Integration of dendrochronological and palaeoecological disturbance reconstructions in temperate mountain forests
https://www.researchgate.net/publication/343359706_Integration_of_dendrochronological_and_palaeoecological_disturbance_reconstructions_in_temperate_mountain_forestsKuosmanen, N., Čada, V., Halsall, K., Chiverrell, R. C., Schafstall, N., Kuneš, P., ... & Clear, J. L. (2020). Integration of dendrochronological and palaeoecological disturbance reconstructions in temperate mountain forests. Forest Ecology and Management, 475, 118413.
-
Quantifying natural disturbances using a large‐scale dendrochronological reconstruction to guide forest management
https://www.researchgate.net/publication/341994628_Quantifying_natural_disturbances_using_a_large-scale_dendrochronological_reconstruction_to_guide_forest_managementČada, V., Trotsiuk, V., Janda, P., Mikoláš, M., Bače, R., Nagel, T. A., ... & Chaskovskyy, O. (2020). Quantifying natural disturbances using a large‐scale dendrochronological reconstruction to guide forest management. Ecological Applications.
-
Climate-growth relationships of Norway Spruce and silver fir in primary forests of the Croatian Dinaric mountains
https://www.researchgate.net/publication/341404218_Climate-growth_relationships_of_Norway_Spruce_and_silver_fir_in_primary_forests_of_the_Croatian_Dinaric_mountainsBegović, K., Rydval, M., Mikac, S., Čupić, S., Svobodova, K., Mikoláš, M., ... & Langbehn, T. (2020). Climate-growth relationships of Norway Spruce and silver fir in primary forests of the Croatian Dinaric mountains. Agricultural and Forest Meteorology, 108000.
-
Historical Disturbances Determine Current Taxonomic, Functional and Phylogenetic Diversity of Saproxylic Beetle Communities in Temperate Primary Forests
https://www.researchgate.net/publication/340798615_Historical_Disturbances_Determine_Current_Taxonomic_Functional_and_Phylogenetic_Diversity_of_Saproxylic_Beetle_Communities_in_Temperate_Primary_ForestsKozák, D., Svitok, M., Wiezik, M., Mikoláš, M., Thorn, S., Buechling, A., ... & Begovič, K. (2020). Historical Disturbances Determine Current Taxonomic, Functional and Phylogenetic Diversity of Saproxylic Beetle Communities in Temperate Primary Forests. Ecosystems, 1-19.
-
Biomass carbon accumulation patterns throughout stand development in primary uneven-aged forest driven by mixed-severity natural disturbances
https://www.sciencedirect.com/science/article/pii/S0378112719306747Seedre, M., Janda, P., Trotsiuk, V., Hedwall, P. O., Morrissey, R. C., Mikoláš, M., ... & Svoboda, M. (2020). Biomass carbon accumulation patterns throughout stand development in primary uneven-aged forest driven by mixed-severity natural disturbances. Forest Ecology and Management, 455, 117676.
-
Relationships between Structural Indices and Conventional Stand Attributes in an Old-Growth Forest in Southeast Europe
https://www.researchgate.net/publication/338084212_Relationships_between_Structural_Indices_and_Conventional_Stand_Attributes_in_an_Old-Growth_Forest_in_Southeast_EuropeKeren, S., Svoboda, M., Janda, P., & Nagel, T. A. (2020). Relationships between Structural Indices and Conventional Stand Attributes in an Old-Growth Forest in Southeast Europe. Forests, 11(1), 4.
-
Contrasting patterns of natural mortality in primary Picea forests of the Carpathian Mountains
https://www.researchgate.net/publication/337783266_Contrasting_patterns_of_natural_mortality_in_primary_Picea_forests_of_the_Carpathian_MountainsSynek, M., Janda, P., Mikoláš, M., Nagel, T. A., Schurman, J. S., Pettit, J. L., ... & Brang, P. (2020). Contrasting patterns of natural mortality in primary Picea forests of the Carpathian Mountains. Forest Ecology and Management, 457, 117734.
-
Climatic drivers of Picea growth differ during recruitment and interact with disturbance severity to influence rates of canopy replacement
https://www.researchgate.net/publication/340016963_Climatic_drivers_of_Picea_growth_differ_during_recruitment_and_interact_with_disturbance_severity_to_influence_rates_of_canopy_replacementSaulnier, M., Schurman, J., Vostarek, O., Rydval, M., Pettit, J., Trotsiuk, V., ... & Svoboda, M. (2020). Climatic drivers of Picea growth differ during recruitment and interact with disturbance severity to influence rates of canopy replacement. Agricultural and Forest Meteorology, 287, 107981.
-
Primary forest distribution and representation in a Central European landscape: Results of a large-scale field-based census
https://www.researchgate.net/publication/334599923_Primary_forest_distribution_and_representation_in_a_Central_European_landscape_Results_of_a_large-scale_field-based_censusMikoláš, M., Ujházy, K., Jasík, M., Wiezik, M., Gallay, I., Polák, P., ... & Trotsiuk, V. (2019). Primary forest distribution and representation in a Central European landscape: Results of a large-scale field-based census. Forest Ecology and Management, 449, 117466.
-
Disentangling the multi-faceted growth patterns of primary Picea abies forests in the Carpathian arc
https://www.researchgate.net/publication/331865063_Disentangling_the_multi-faceted_growth_patterns_of_primary_Picea_abies_forests_in_the_Carpathian_arcBjörklund, J., Rydval, M., Schurman, J. S., Seftigen, K., Trotsiuk, V., Janda, P., ... & Svoboda, M. (2019). Disentangling the multi-faceted growth patterns of primary Picea abies forests in the Carpathian arc. Agricultural and Forest Meteorology, 271, 214-224.
-
The climatic drivers of primary Picea forest growth along the Carpathian arc are changing under rising temperatures
https://www.researchgate.net/publication/333618979_The_climatic_drivers_of_primary_Picea_forest_growth_along_the_Carpathian_arc_are_changing_under_rising_temperaturesSchurman, J. S., Babst, F., Björklund, J., Rydval, M., Bače, R., Čada, V., ... & Svoboda, M. (2019). The climatic drivers of primary Picea forest growth along the Carpathian arc are changing under rising temperatures. Global change biology.
-
Increased sensitivity to drought across successional stages in natural Norway spruce (Picea abies (L.) Karst.) forests of the Calimani Mountains, Romania
https://www.researchgate.net/publication/332918415_Increased_sensitivity_to_drought_across_successional_stages_in_natural_Norway_spruce_Picea_abies_L_Karst_forests_of_the_Calimani_Mountains_RomaniaSvobodová, K., Langbehn, T., Björklund, J., Rydval, M., Trotsiuk, V., Morrissey, R. C., ... & Schurman, J. S. (2019). Increased sensitivity to drought across successional stages in natural Norway spruce (Picea abies (L.) Karst.) forests of the Calimani Mountains, Romania. Trees, 1-15.
-
Disentangling the multi-faceted growth patterns of primary Picea abies forests in the Carpathian arc
https://www.researchgate.net/publication/331865063_Disentangling_the_multi-faceted_growth_patterns_of_primary_Picea_abies_forests_in_the_Carpathian_arcBjörklund, J., Rydval, M., Schurman, J. S., Seftigen, K., Trotsiuk, V., Janda, P., ... & Svoboda, M. (2019). Disentangling the multi-faceted growth patterns of primary Picea abies forests in the Carpathian arc. Agricultural and Forest Meteorology, 271, 214-224.
-
Patterns of forest dynamics in a secondary old-growth beech-dominated forest in the Jizera Mountains Beech Forest Reserve, Czech Republic
http://www.sisef.it/iforest/abstract/?id=ifor2702-011Lábusová, J., Morrissey, R. C., Trotsiuk, V., Janda, P., Bače, R., Cada, V., ... & Mateju, L. (2019). Patterns of forest dynamics in a secondary old-growth beech-dominated forest in the Jizera Mountains Beech Forest Reserve, Czech Republic. iForest-Biogeosciences and Forestry, 12(1), 17.
-
Early-Warning Signals of Individual Tree Mortality Based on Annual Radial Growth
https://www.researchgate.net/publication/330221683_Early-Warning_Signals_of_Individual_Tree_Mortality_Based_on_Annual_Radial_GrowthCailleret, M., Dakos, V., Jansen, S., Robert, E. M., Aakala, T., Amoroso, M. M., ... & Camarero, J. J. (2018). Early-warning signals of individual tree mortality based on annual radial growth. Frontiers in Plant Science, 9, 1964.
-
Arthropod communities in fungal fruitbodies are weakly structured by climate and biogeography across European beech forests
https://www.researchgate.net/publication/330364554_Arthropod_communities_in_fungal_fruitbodies_are_weakly_structured_by_climate_and_biogeography_across_European_beech_forestsFriess, N., Müller, J. C., Aramendi, P., Bässler, C., Brändle, M., Bouget, C., ... & Gossner, M. M. (2019). Arthropod communities in fungal fruitbodies are weakly structured by climate and biogeography across European beech forests. Diversity and Distributions.
-
Drivers of basal area variation across primary late-successional Picea abies forests of the Carpathian Mountains
https://www.researchgate.net/publication/330311534_Drivers_of_basal_area_variation_across_primary_late-successional_Picea_abies_forests_of_the_Carpathian_MountainsJanda, P., Tepley, A. J., Schurman, J. S., Brabec, M., Nagel, T. A., Bače, R., ... & Frankovič, M. (2019). Drivers of basal area variation across primary late-successional Picea abies forests of the Carpathian Mountains. Forest Ecology and Management, 435, 196-204.
-
Patterns and drivers of recent disturbances across the temperate forest biome
https://www.researchgate.net/publication/328388694_Patterns_and_drivers_of_recent_disturbances_across_the_temperate_forest_biomeSommerfeld, A., Senf, C., Buma, B., D’Amato, A. W., Després, T., Díaz-Hormazábal, I., ... & Harvey, B. J. (2018). Patterns and drivers of recent disturbances across the temperate forest biome. Nature communications, 9(1), 4355.
-
Influence of sampling and disturbance history on climatic sensitivity of temperature-limited conifers
https://www.researchgate.net/publication/326637528_Influence_of_sampling_and_disturbance_history_on_climatic_sensitivity_of_temperature-limited_conifersRydval, M., Druckenbrod, D. L., Svoboda, M., Trotsiuk, V., Janda, P., Mikoláš, M., ... & Wilson, R. (2018). Influence of sampling and disturbance history on climatic sensitivity of temperature-limited conifers. The Holocene, 28(10), 1574-1587.
-
Drought-induced shift in tree response to climate in floodplain forests of Southeastern Europe
https://www.researchgate.net/publication/328784387_Drought-induced_shift_in_tree_response_to_climate_in_floodplain_forests_of_Southeastern_EuropeMikac, S., Žmegač, A., Trlin, D., Paulić, V., Oršanić, M., & Anić, I. (2018). Drought-induced shift in tree response to climate in floodplain forests of Southeastern Europe. Scientific reports, 8(1), 16495.
-
Deadwood management in Central European forests: Key considerations for practical implementation
https://www.researchgate.net/publication/326624745_Deadwood_management_in_Central_European_forests_Key_considerations_for_practical_implementationVítková, L., Bače, R., Kjučukov, P., & Svoboda, M. (2018). Deadwood management in Central European forests: Key considerations for practical implementation. Forest Ecology and Management, 429, 394-405.
-
Profile of tree-related microhabitats in European primary beech-dominated forests
https://www.researchgate.net/publication/326571830_Profile_of_tree-related_microhabitats_in_European_primary_beech-dominated_forestsKozák, D., Mikoláš, M., Svitok, M., Bače, R., Paillet, Y., Larrieu, L., ... & Frankovič, M. (2018). Profile of tree-related microhabitats in European primary beech-dominated forests. Forest Ecology and Management, 429, 363-374.
-
Contrasting effects of environmental change on the radial growth of co-occurring beech and fir trees across Europe
https://www.researchgate.net/publication/320487350_Contrasting_effects_of_environmental_change_on_the_radial_growth_of_co-occurring_beech_and_fir_trees_across_Europe?ev=publicSearchHeader&_sg=_GOl84xsa65WGvnxrY-od-4HySk8TGYEQNB2sTUL-UatJmzSPw27Hk_F2YqBosela, M., Lukac, M., Castagneri, D., Sedmák, R., Biber, P., Carrer, M., ... & Roibu, C. C. (2018). Contrasting effects of environmental change on the radial growth of co-occurring beech and fir trees across Europe. Science of The Total Environment, 615, 1460-1469.
-
Where are Europe’s last primary forests?
https://www.researchgate.net/publication/325360584_Where_are_Europe%27s_last_primary_forests?ev=publicSearchHeader&_sg=ltNS6gNC7zZxH6J85xG7kzjg44rBwYIXKf9OgkCWpDIDXLY3n_kjkW1Rmry6nSGIZyuSuOUulf2FIGkSabatini, F. M., Burrascano, S., Keeton, W. S., Levers, C., Lindner, M., Pötzschner, F., ... & Debaive, N. Where are Europe’s last primary forests?. Diversity and Distributions.
-
Large-scale disturbance legacies and the climate sensitivity of primary Picea abies forests
https://www.researchgate.net/publication/322388201_Large-scale_disturbance_legacies_and_the_climate_sensitivity_of_primary_Picea_abies_forestsSchurman, J. S., Trotsiuk, V., Bače, R., Čada, V., Fraver, S., Janda, P., ... & Seidl, R. (2018). Large‐scale disturbance legacies and the climate sensitivity of primary Picea abies forests. Global change biology.
-
Long-term responses of canopy–understorey interactions to disturbance severity in primary Picea abies forests
https://www.researchgate.net/publication/320005342_Long-term_responses_of_canopy-understory_interactions_to_disturbance_severity_in_primary_Picea_abies_forests?ev=publicSearchHeader&_sg=WgnoBQxHOg5gjmEXYx4kssq5kf2Jta6dtQnXOvMnKAwEtkK4Nk6A13HYxeUdBbOurBače, R., Schurman, J. S., Brabec, M., Čada, V., Després, T., Janda, P., ... & Nagel, T. A. (2017). Long‐term responses of canopy–understorey interactions to disturbance severity in primary Picea abies forests. Journal of Vegetation Science, 28(6), 1128-1139.
-
Past disturbances and intraspecific competition as drivers of spatial pattern in primary spruce forests
https://www.researchgate.net/publication/321867969_Past_disturbances_and_intraspecific_competition_as_drivers_of_spatial_pattern_in_primary_spruce_forests?ev=publicSearchHeader&_sg=BhAkpOGI1wY0gtv7wixpYnZWATnT3ev5MSFsoXw-6LB9JyoI7pSDjZ8p06vWqWQkxV4OT4Després, T., Vítková, L., Bače, R., Čada, V., Janda, P., Mikoláš, M., ... & Svoboda, M. (2017). Past disturbances and intraspecific competition as drivers of spatial pattern in primary spruce forests. Ecosphere, 8(12).
-
Old trees as a key source of epiphytic lichen persistence and spatial distribution in mountain Norway spruce forests
https://www.researchgate.net/publication/316362494_Old_trees_as_a_key_source_of_epiphytic_lichen_persistence_and_spatial_distribution_in_mountain_Norway_spruce_forests?ev=publicSearchHeader&_sg=c97R6ngoWL0U_MdnGff1egHj4qKT60zw0qjx6b3CQZgBOtHHuiA3dTqdFZemanová, L., Trotsiuk, V., Morrissey, R. C., Bače, R., Mikoláš, M., & Svoboda, M. (2017). Old trees as a key source of epiphytic lichen persistence and spatial distribution in mountain Norway spruce forests. Biodiversity and Conservation, 26(8), 1943-1958.
-
A matter of time: self-regulated tree regeneration in a natural Norway spruce (Picea abies) forest at Mt. Brocken, Germany
https://www.researchgate.net/publication/320782120_A_matter_of_time_self-regulated_tree_regeneration_in_a_natural_Norway_spruce_Picea_abies_forest_at_Mt_Brocken_Germany?ev=publicSearchHeader&_sg=9XEqHfo857B3PrW2aB-qSxbzlTU0yWeX6M-X9fxLWW-cFjneK6SLf_tIMeyer, P., Janda, P., Mikoláš, M., Trotsiuk, V., Krumm, F., Mrhalová, H., ... & Svoboda, M. (2017). A matter of time: self-regulated tree regeneration in a natural Norway spruce (Picea abies) forest at Mt. Brocken, Germany. European Journal of Forest Research, 136(5-6), 907-921.
-
The natural disturbance regime in forests of the Dinaric Mountains: A synthesis of evidence
https://www.researchgate.net/publication/306003906_The_natural_disturbance_regime_in_forests_of_the_Dinaric_Mountains_A_synthesis_of_evidence?ev=publicSearchHeader&_sg=KeNZObfdKnB-luUK_oz0eEIi1iwCKR1v2oZkOLkjBhGBJA_RAhoi4AKo99vab-LWa0VG3YCs0vvnlikNagel, T. A., Mikac, S., Dolinar, M., Klopcic, M., Keren, S., Svoboda, M., ... & Paulic, V. (2017). The natural disturbance regime in forests of the Dinaric Mountains: A synthesis of evidence. Forest ecology and management, 388, 29-42.
-
More ways than one: Mixed-severity disturbance regimes foster structural complexity via multiple developmental pathways
https://www.researchgate.net/publication/320831838_More_ways_than_one_Mixed-severity_disturbance_regimes_foster_structural_complexity_via_multiple_developmental_pathwaysMeigs, G. W., Morrissey, R. C., Bače, R., Chaskovskyy, O., Čada, V., Després, T., ... & Mikoláš, M. (2017). More ways than one: Mixed-severity disturbance regimes foster structural complexity via multiple developmental pathways. Forest Ecology and Management, 406, 410-426.
-
Mixed-severity natural disturbances promote the occurrence of an endangered umbrella species in primary forests
https://www.researchgate.net/publication/319990112_Mixed-severity_natural_disturbances_promote_the_occurrence_of_an_endangered_umbrella_species_in_primary_forestsMikoláš, M., Svitok, M., Bollmann, K., Reif, J., Bače, R., Janda, P., ... & Coppes, J. (2017). Mixed-severity natural disturbances promote the occurrence of an endangered umbrella species in primary forests. Forest Ecology and Management, 405, 210-218.
-
The central role of disturbances in mountain forests of Europe
Kulakowski, D., Svoboda, M., & Bebi, P. (2017). The central role of disturbances in mountain forests of Europe.https://www.researchgate.net/publication/308802382_The_central_role_of_disturbances_in_mountain_forests_of_Europe -
The historical disturbance regime of mountain Norway spruce forests in the Western Carpathians and its influence on current forest structure and composition
https://www.researchgate.net/publication/308047323_The_historical_disturbance_regime_of_mountain_Norway_spruce_forests_in_the_Western_Carpathians_and_its_influence_on_current_forest_structure_and_compositionJanda, P., Trotsiuk, V., Mikoláš, M., Bače, R., Nagel, T. A., Seidl, R., ... & Jasík, M. (2017). The historical disturbance regime of mountain Norway spruce forests in the Western Carpathians and its influence on current forest structure and composition. Forest Ecology and Management, 388, 67-78.
-
Forest management impacts on capercaillie (Tetrao urogallus) habitat distribution and connectivity in the Carpathians
https://www.researchgate.net/publication/306433188_Forest_management_impacts_on_capercaillie_Tetrao_urogallus_habitat_distribution_and_connectivity_in_the_CarpathiansMikoláš, M., Tejkal, M., Kuemmerle, T., Griffiths, P., Svoboda, M., Hlásny, T., ... & Morrissey, R. C. (2017). Forest management impacts on capercaillie (Tetrao urogallus) habitat distribution and connectivity in the Carpathians. Landscape Ecology, 32(1), 163-179.
-
A walk on the wild side: Disturbance dynamics and the conservation and management of European mountain forest ecosystems
https://www.researchgate.net/publication/307545699_A_walk_on_the_wild_side_Disturbance_dynamics_and_the_conservation_and_management_of_European_mountain_forest_ecosystemsKulakowski, D., Seidl, R., Holeksa, J., Kuuluvainen, T., Nagel, T. A., Panayotov, M., ... & Wohlgemuth, T. (2017). A walk on the wild side: disturbance dynamics and the conservation and management of European mountain forest ecosystems. Forest Ecology and Management, 388, 120-131.
-
Frequent severe natural disturbances and non-equilibrium landscape dynamics shaped the mountaine spruce forest in central Europe
https://www.researchgate.net/publication/289367733_Frequent_severe_natural_disturbances_and_non-equilibrium_landscape_dynamics_shaped_the_mountain_spruce_forest_in_central_EuropeČada, V., Morrissey, R. C., Michalová, Z., Bače, R., Janda, P., & Svoboda, M. (2016). Frequent severe natural disturbances and non-equilibrium landscape dynamics shaped the mountain spruce forest in central Europe. Forest Ecology and Management, 363, 169-178.
-
A synthesis of radial growth patterns preceding tree mortality
https://www.researchgate.net/publication/309299379_A_synthesis_of_radial_growth_patterns_preceding_tree_mortalityCailleret, M., Jansen, S., Robert, E. M., Desoto, L., Aakala, T., Antos, J. A., ... & Čada, V. (2016). A synthesis of radial growth patterns preceding tree mortality. Global change biology.
-
The legacy of disturbance on individual tree and stand-level aboveground biomass accumulation and stocks in primary mountain Picea abies forests
https://www.researchgate.net/publication/301662012_The_legacy_of_disturbance_on_individual_tree_and_stand-level_aboveground_biomass_accumulation_and_stocks_in_primary_mountain_Picea_abies_forestsTrotsiuk, V., Svoboda, M., Weber, P., Pederson, N., Klesse, S., Janda, P., ... & Mateju, L. (2016). The legacy of disturbance on individual tree and stand-level aboveground biomass accumulation and stocks in primary mountain Picea abies forests. Forest Ecology and Management, 373, 108-115.
-
Legacy of pre-disturbance spatial pattern determines early structural diversity following severe disturbance in montane spruce forests
https://www.researchgate.net/publication/282346363_Legacy_of_Pre-Disturbance_Spatial_Pattern_Determines_Early_Structural_Diversity_following_Severe_Disturbance_in_Montane_Spruce_ForestsBače, R., Svoboda, M., Janda, P., Morrissey, R. C., Wild, J., Clear, J. L., ... & Donato, D. C. (2015). Legacy of pre-disturbance spatial pattern determines early structural diversity following severe disturbance in montane spruce forests. PloS one, 10(9), e0139214.
-
Age, competition, disturbance and elevation effects on tree and stand growth response of primary Picea abies forest to climate
https://www.researchgate.net/publication/280234204_Age_competition_disturbance_and_elevation_effects_on_tree_and_stand_growth_response_of_primary_Picea_abies_forest_to_climatePrimicia, I., Camarero, J. J., Janda, P., Čada, V., Morrissey, R. C., Trotsiuk, V., ... & Svoboda, M. (2015). Age, competition, disturbance and elevation effects on tree and stand growth response of primary Picea abies forest to climate. Forest Ecology and Management, 354, 77-86.
-
Evaluating forest management intensity on an umbrella species: Capercaillie persistence in central Europe
https://www.researchgate.net/publication/280141748_Evaluating_forest_management_intensity_on_an_umbrella_species_Capercaillie_persistence_in_central_EuropeMikoláš, M., Svitok, M., Tejkal, M., Leitão, P. J., Morrissey, R. C., Svoboda, M., ... & Fontaine, J. B. (2015). Evaluating forest management intensity on an umbrella species: Capercaillie persistence in central Europe. Forest Ecology and Management, 354, 26-34.
-
Forests: Not just timber plantations
https://www.researchgate.net/publication/276068184_Forests_Not_just_timber_plantationsJonsson, B. G., Pe'Er, G., & Svoboda, M. (2015). Forests: not just timber plantations. Nature, 521(7550), 32-32.
-
A mixed severity disturbance regime in the primary Picea abies (L.) Karst. forests of the Ukrainian Carpathians
https://www.researchgate.net/publication/266142370_A_mixed_severity_disturbance_regime_in_the_primary_Picea_abies_L_Karst_forests_of_the_Ukrainian_CarpathiansTrotsiuk, V., Svoboda, M., Janda, P., Mikolas, M., Bace, R., Rejzek, J., ... & Myklush, S. (2014). A mixed severity disturbance regime in the primary Picea abies (L.) Karst. forests of the Ukrainian Carpathians. Forest Ecology and Management, 334, 144-153.
-
Landscape-level variability in historical disturbance in primary Picea abies mountain forests of the Eastern Carpathians, Romania
https://www.researchgate.net/publication/259389775_Landscape-level_variability_in_historical_disturbance_in_primary_Picea_abies_mountain_forests_of_the_Eastern_Carpathians_RomaniaSvoboda, M., Janda, P., Bače, R., Fraver, S., Nagel, T. A., Rejzek, J., ... & Čada, V. (2014). Landscape‐level variability in historical disturbance in primary Picea abies mountain forests of the eastern Carpathians, Romania. Journal of vegetation science, 25(2), 386-401.
-
Continued loss of temperate old-growth forests in the Romanian Carpathians despite an increasing protected area network
https://www.researchgate.net/publication/259432991_Continued_loss_of_temperate_old-growth_forests_in_the_Romanian_Carpathians_despite_an_increasing_protected_area_networkKnorn, J. A. N., Kuemmerle, T., Radeloff, V. C., Keeton, W. S., Gancz, V., BIRIŞ, I. A., ... & Hostert, P. (2013). Continued loss of temperate old-growth forests in the Romanian Carpathians despite an increasing protected area network. Environmental Conservation, 40(02), 182-193.
Article 1/1
Frequent severe natural disturbances and non-equilibrium landscape dynamics shaped the mountaine spruce forest in central Europe
FULL VERSION ABOVE
Disturbances shape forest structure and composition, but the temporal dynamics of disturbance patterns, their influence on dynamics of forest structural complexity, and the potential impacts of ongoing climate changes are not fully understood. We addressed these issues by focusing on (1) long-term, landscape level retrospective analysis of disturbance dynamics of mountain Norway spruce (Picea abies) forest; (2) testing for the prevailing disturbance agent; and (3) the detection of disturbance drivers, particularly site conditions, using a dendrochronological approach.
We had a unique opportunity to sample a large area of natural forest (in otherwise altered region) in Bohemian Forest, that was recently affected by extensive and severe wind and bark beetle disturbances raising management concerns. Tree-ring series of a minimum of 35 trees on each of the 26 study plots were analysed for signals of past disturbances that were indicated either by release from suppression (rapid growth increase) or rapid early growth rate (gap origin).
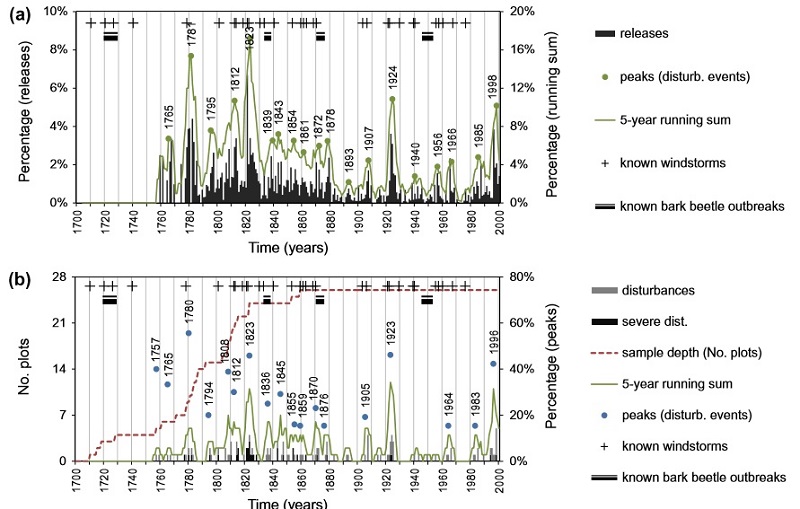
A broad range of disturbance severities were detected across the landscape, but severe disturbances (>50 % trees responded), with a short rotation period of 174 years, best characterize the area. Reconstructed disturbances were associated with historically documented windstorms and bark beetle outbreaks. They were distributed across the landscape and affected its large portions with spatially variable severity. Over the last five centuries, disturbances peaked in the 1820s, but were rare after 1880. This non-equilibrium dynamics resulted into mature landscape structure at the end of 20th century and contributed to the large extent of disturbances in the last two decades. Disturbances were more frequent on wind-exposed locations such as mountain ridges and flatter terrain.
Frequent disturbances did not allow the forest to develop into an old-growth phase; rather disturbance events of variable severities created structures important for biodiversity and could also preserve key early-seral phases in the landscape. We anticipate that potential future increase of disturbance intensities will not lead to comparable regime shifts in forests shaped by high-severity disturbances that kill largely mature trees (e.g., wind and bark beetle), because such disturbances are followed by resistant forest structure. Conservation areas should be large enough to allow for a wide range of disturbances. Emphasizing ecological functions needs understanding of biological legacies of natural disturbances and managers could partly rely on natural events to restore natural features into cultivated forests.
Description of attachments: On the first picture you can see annual resolution of chronologies of growth releases only showing the synchronization of disturbances at the level of individual trees; and (b) summary of peaks (indicating individual disturbance events) in the same chronologies at the plot level referred to disturbances and severe disturbances, >10 % and >50 % released trees, respectively. Peaks in 5-year running sum (blue dots) were calculated proportional to sample depth. For example, during the 5-year period around 1780, 56 % of available plots (5 out of 9 plots) indicate disturbance by growth releases. Reconstructed disturbance events (peaks) were significantly associated with known windstorms and bark beetle outbreaks evidenced in the archived documents of the surrounding region.
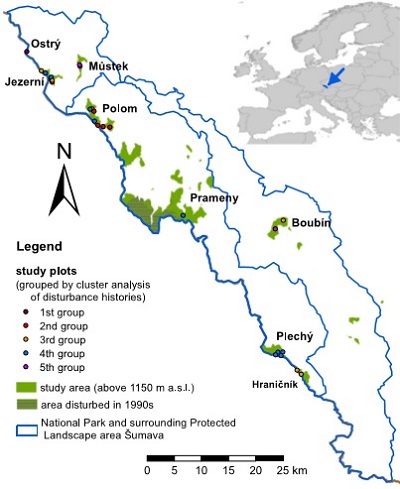
The second one shows location of the study area within the National Park and Protected Landscape Area Šumava in the Czech portion of the Bohemian Forest. The contour of 1150 m a.s.l. corresponds to the distribution of mountain Norway spruce (Picea abies) forest type restricting the study area and individual localities. We did not analyse two central localities because one was disturbed in 1990th (impossible core extraction) and second was likely harvested in late 19th century. Groups of plots obtained by cluster analysis of disturbance histories are shown.
Article 1/1
Article 1/1
Legacy of pre-disturbance spatial pattern determines early structural diversity following severe disturbance in montane spruce forests
FULL VERSION ABOVE
Severe canopy-removing disturbances are native to many temperate forests and radically alter stand structure, but biotic legacies (surviving elements or patterns) can lend continuity to ekosystém function after such events. Poorly understood is the degree to which the structural complexity of an old-growth forest carries over to the next stand. We asked how predisturbance spatial pattern acts as a legacy to influence post-disturbance stand structure, and how this legacy in fluences the structural diversity within the early-seral stand.
Two stem-mapped one-hectare forest plots in the Czech Republic experienced a severe bark beetle outbreak, thus providing before-and-after data on spatial patterns in live and dead trees, crown projections, downlogs, and herb cover.
Post-disturbance stands were dominated by an advanced regeneration layer present before the disturbance. Both major species, Norway spruce (Picea abies) and rowan (Sorbus aucuparia), were strongly self-aggregated and also clustered to former canopy trees, predisturbance snags, stumps and logs, suggesting positive overstory to understory neighbourhood effects. Thus, although the disturbance dramatically reduced the stand’s height profile with ~100% mortality of the canopy layer, the spatial structure of post-disturbance stands still closely reflected the pre-disturbance structure. The former upper tree layer in fluenced advanced regeneration through microsite and light limitation. Under formerly dense canopies, regeneration density was high but relatively homogeneous in height; while in former small gaps with greater herb cover, regeneration density was lower but with greater heterogeneity in heights.
These findings suggest that pre-disturbance spatial patterns of forests can persist through severe canopy-removing disturbance, and determine the spatial structure of the succeeding stand. Such patterns constitute a subtle but key legacy effect, promoting structural complexity in early-seral forests as well as variable successional pathway sandrates. This influence suggests a continuity in spatial ekosystem structure that may well persist through multiple forest generations.
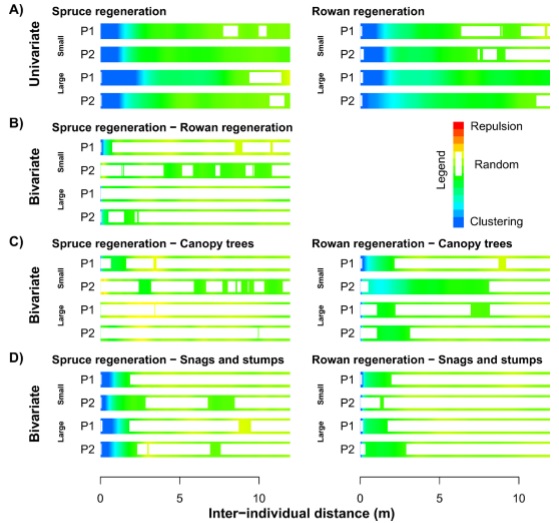
Description of attachments: On the first picture you can see spatial patterns of regeneration. A) Spatial patterns of saplings (small: 50–90cm, large: 90–200 cm); B) spatial relationship between spruce and rowan saplings; C) spatial relationship between saplings and canopy living trees and D) spatial relationship between saplings and snags or stumps evaluated with univariate and bivariate pair correlation function. Both strongly self-aggregated spruce and rowan saplings are clustered to canopy (>25m) trees, snag and stumps.
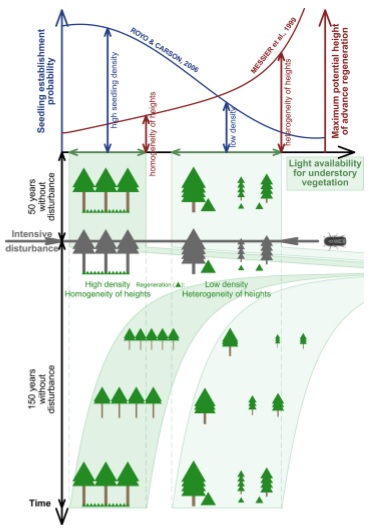
On the second one you can see the conceptual figure illustrates how the structural complexity of an old-growth forest carries over to the next stand, inspite of a severe canopy-removing bark beetle disturbance. Structurally simple patches dominated by a dense overstory tend to be replaced by a young simple cohort (high density, more evenly spatially distributed, shorter and more uniform heights). Structurally complex patches that include gaps tend to be replaced by with a similarly complex young cohort (lower density, larger patches of open space, greater maximum and wider variability in heights). This difference in post-disturbance early-seral structural development pathways is attributed to light conditions and microsite availability when the advance regeneration bank was formed: Under densely closed canopies, there are suitable microsite conditions (sparse herb layer) for seedling establishment but not enough light for sustainable height growth over a certain threshold. In contrast, under moderate canopy cover, the establishment of new seedlings is inhibited by a dense herb layer. Seedlings and saplings that do manage to establish in these patches are subject to mortality due to resource competition by the herb layer, resulting in lower advance regeneration density, larger patches of open space and wider height variability under moderate canopy cover.
Article 1/1
Article 1/2
Profile of tree-related microhabitats in European primary beech-dominated forests
FULL VERSION ABOVE
Tree-related microhabitats (TreMs) are important features for the conservation of biodiversity in forest ecosystems. Although other structural indicators of forest biodiversity have been extensively studied in recent decades, TreMs have often been overlooked, either due to the absence of a consensual definition or a lack of knowledge. Despite the increased number of TreM studies in the last decade, the role of drivers of TreM profile in primary forests and across different geographical regions is still unknown.
To evaluate the main drivers of TreM density and diversity, we conducted the first large-scale study of TreMs across European primary forests. We established 146 plots in eight primary forests dominated by European beech (Fagus sylvatica L.) in the Carpathian and Dinaric mountain ranges. Generalized linear mixed effect models were used to test the effect of local plot characteristics and spatial variability on the density and diversity (alpha, beta, and gamma) of TreMs.
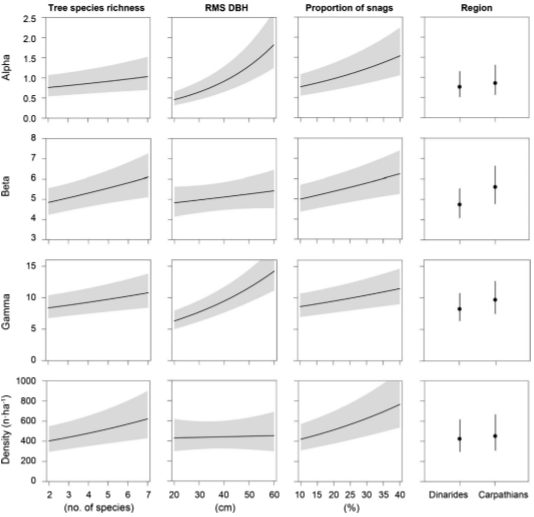
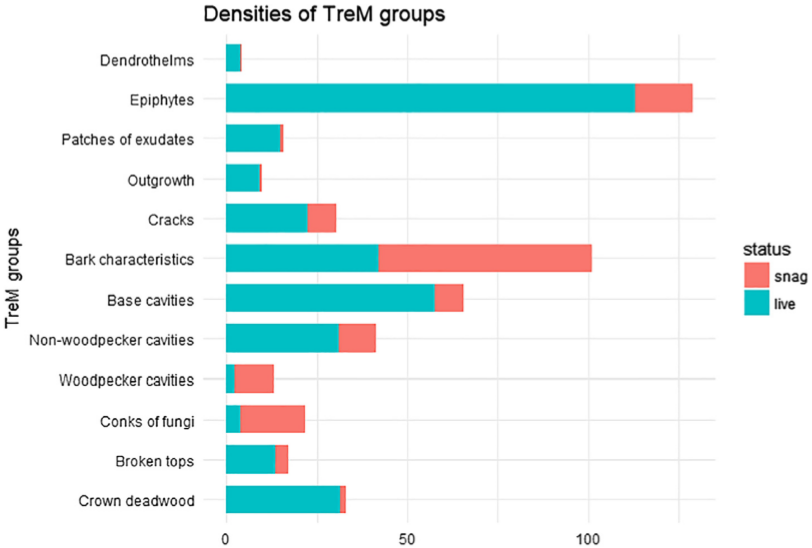
Total TreM density and diversity were significantly positively related with tree species richness and the proportion of snags. Root mean square tree diameters were significantly related to alpha and gamma diversity of TreMs. Both regions reached similarly high values of total TreM densities and total TreM densities and diversity were not significantly different between the two regions; however, we observed between the two regions significant differences in the densities of two TreM groups, conks of fungi and epiphytes. The density and diversity of TreMs were very high in beech-dominated mountain primary forests, but their occurrence and diversity was highly variable within the landscapes over relatively short spatial gradients (plot and stand levels). Understanding these profile provides a benchmark for further comparisons, such as with young forest reserves, or for improving forest management practices that promote biodiversity.
Description of attachments: On the first picture you can see effect plots showing the results of GLMMs testing for the effect of tree species richness, RMS DBH, proportion of snags, and region on diversity (alpha, beta and gamma) and density of TreMs. Predicted values (lines, circles) are displayed along with 95% confidence intervals (gray polygons, error bars).
On the second one you can see comparison of densities of TreM groups between snags and living trees.
Forest management impacts on capercaillie (Tetrao urogallus) habitat distribution and connectivity in the Carpathians
FULL VERSION ABOVE
Distribution and connectivity of suitable habitat for species of conservation concern is critical for effective conservation planning. Capercaillie (Tetrao urogallus), an umbrella species for biodiversity conservation, is increasingly threatened because of habitat loss and fragmentation.
We assessed the impact of drastic changes in forest management in the Carpathian Mountains, a major stronghold of capercaillie in Europe, on habitat distribution and connectivity.
We used field data surveys with a forest disturbance dataset for 1985–2010 to map habitat suitability, and we used graph theory toanalyse habitat connectivity.
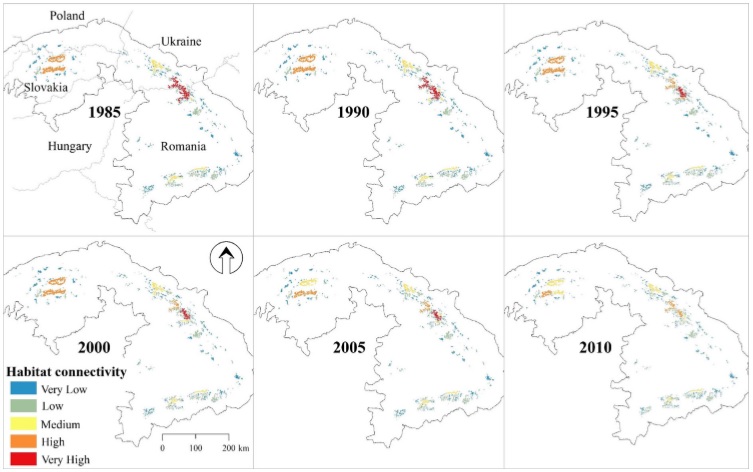
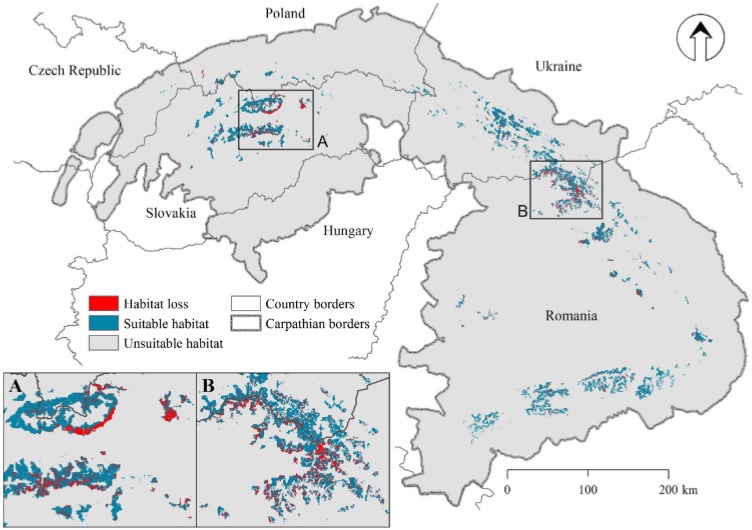
Climate, topography, forest proportion and fragmentation, and the distance to roads and settlements best identified capercaillie presence. Suitable habitat area was 7,510 km2 in 1985; by 2010, clear-cutting had reduced that area by 1,110 km2. More suitable habitat was lost inside protected areas (571 km2) than outside (413 km2). Habitat loss of 15 % reduced functional connectivity by 33 % since 1985.
Forest management, particularly largescale clear-cutting and salvage logging, have substantially diminished and fragmented suitable capercaillie habitat, regardless of the status of forest protection. Consequently, larger areas with suitable habitat are now isolated and many patches are too small to sustain viable populations. Given that protection of capercaillie habitat would benefit many other species, including old-growth specialists and large carnivores, conservation actions to halt the loss of capercaillie habitat is urgently needed. We recommend adopting policies to protect natural forests, limiting large-scale clear-cutting and salvage logging, implementing ecological forestry, and restricting road building to reduce forest fragmentation.
Description of attachments: On the first picture you can see forest disturbance patterns between 1985 and 2010, which almost exclusively represent clear-cutting and postdisturbance salvage logging, compared to capercaillie habitat in the Carpathians. Frames A and B focus on the Low and High Tatra Mountains and the Maramures region in Romania, respectively.
The second one shows change in the importance of individual capercaillie habitat patches between 1985 and 2010, measured by importance of habitat patch based on probability of connectivity index (dPC) based on a dispersal distance of 2.5 km. The importance of the habitat patches is classified into five levels based on dPC value: 0–1 (very low); 1–3 (low); 3–9 (medium); 9–27 (high).
Article 1/2
Article 1/1
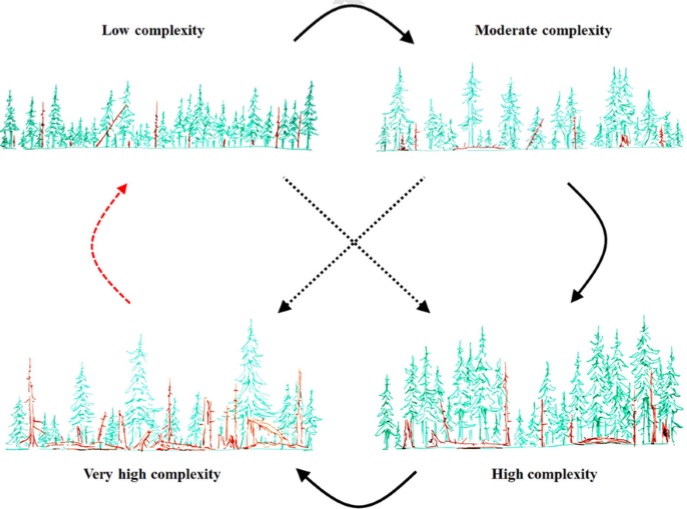
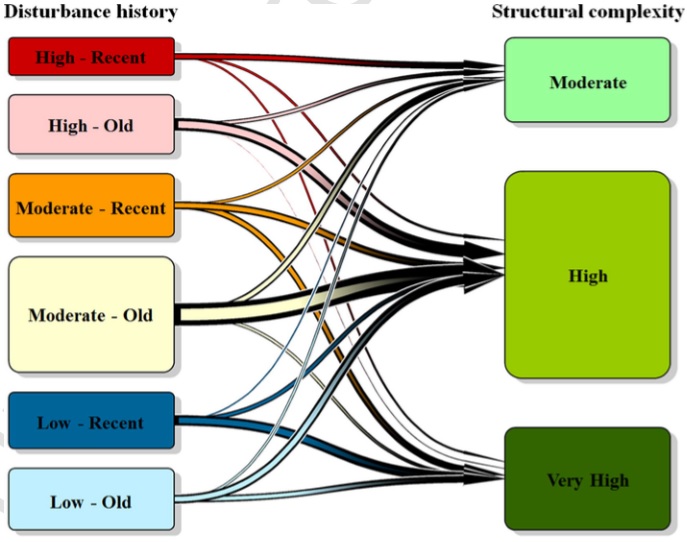
More ways than one: Mixed-severity disturbance regimes foster structural complexity via multiple developmental pathways
FULL VERSION ABOVE
Quantifying the patterns and consequences of natural disturbance is vital for conserving biodiversity and ecosystem services. Mixed-severity disturbance regimes are prevalent in temperate forests worldwide, but key uncertainties remain regarding the variability of disturbance-mediated structural development pathways. This study investigates the influence of disturbance history on current structure in primary, unmanaged Norway spruce (Picea abies) forests throughout the Carpathian Mountains of central and eastern Europe, where windstorms and native bark beetle outbreaks are the dominant natural disturbances.
We inventoried forest structure on 453 plots (0.1 ha) spanning a large geographical gradient (1000 km), coring 15–25 canopy trees per plot for disturbance history reconstruction (tree core total n=11,309). Our specific objectives were to: (1) classify sub-hectare-scale disturbance history based on disturbance timing and severity; (2) classify current forest structure based on tree size distributions (live, dead, standing, downed); (3) characterize structural development pathways as revealed by the association between disturbance history and current forest structural complexity.
We used hierarchical cluster analysis for the first two objectives and indicator analysis for the third. The disturbance-based cluster analysis yielded six groups associated with three levels of disturbance severity (low, moderate, and high canopy loss) and two levels of timing (old, recent) over the past 200years. The structure-based cluster analysis yielded three groups along a gradient of increasing structural complexity. A large majority of plots exhibited relatively high (53 %) or very high (26 %) structural complexity, indicated by abundant large live trees, standing and downed dead trees, and spruce regeneration.
Consistent with conventional models of structural development, some disturbance history groups were associated with specific structural complexity groups, particularly low-severity, recent (very high complexity) and high-severity, recent (moderate complexity) disturbances. In other cases, however, the distribution of plots among disturbance history and structural complexity groups indicated either divergent or convergent pathways. For example, multiple disturbance history groups were significantly associated with the high complexity group, demonstrating structural convergence. These results illustrate that complex forest structure – including features nominály associated with old-growth – can be associated as much with disturbance severity as it is with conventional notions of forest age. In addition, natural disturbances can induce relatively high levels of tree mortality while simultaneously contributing to the development of structural complexity at sub-hectare scales.
This study in primary forests can inform policy and management initiatives intended to emulate natural forest dynamics across mountain landscapes, particularly given projections of increasing disturbance aktivity under global change.
Description of attachments: On the first picture you can see transition plot showing associations between disturbance history groups and current forest structure groups. Box height corresponds to number of plots in each group. Line thick-ness corresponds to the relative number of plots associated with each pairwise combination. We tested these transitions quantitatively with indicator analysis.
The second one shows conceptual model of disturbance-mediated structural development in primary Norway spruce forests shaped by a mixed-severity disturbance regime.
Article 1/1
Article 1/1
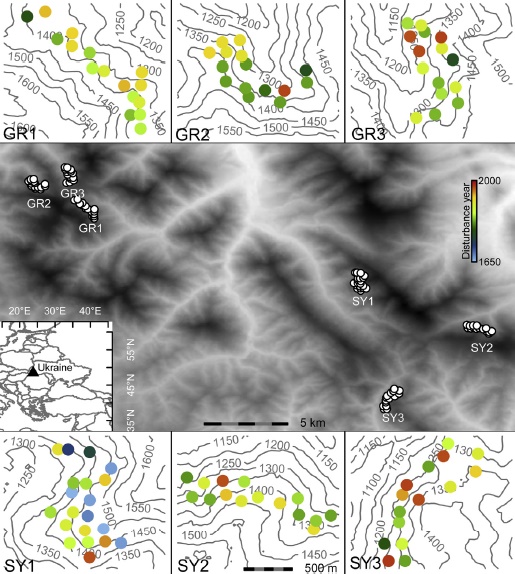
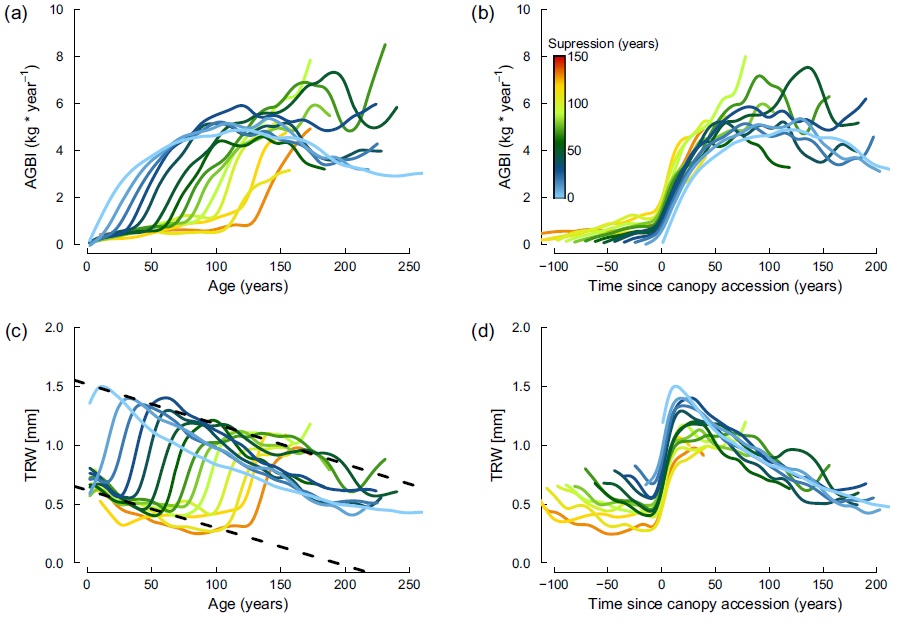
The legacy of disturbance on individual tree and stand-level aboveground biomass accumulation and stocks in primary mountain Picea abies forests
FULL VERSION ABOVE
Disturbances, both natural and human induced, influence forest dynamics, ecosystem functioning, and ecosystem services. Here, we aim to evaluate the consequences of natural disturbances on the magnitude and dynamics of tree- and stand-level biomass accumulation from decadal to centennial scales. We use tree-ring data from 2301 trees and biometric data from 4,909 trees sampled in 96 plots (each 1000 m2) to quantify the influence of mixed severity disturbance regimes on annual aboveground biomass inkrement (AGBI) and total aboveground biomass accumulation (AGB) across a mountainous monotypic Norway spruce (Picea abies (L.) Karst.) primary forest.
We hypothesise that the multiple internal and external factors constraining tree growth will cause differences in tree and stand-level biomass trajectories in these natural forests. Although we found that tree-level AGB growth increases with tree size,we also found that tree age and disturbance legacies plays a crucial role for AGB in the investigated Norway spruce forests. Importantly, while younger trees of the same diameter class have an average current AGBI rate that is ~225 % higher than older trees (300–400 years), we find trees that have been suppressed for up to 120 years can respond vigorously when competition is reduced. On average, post disturbance AGBI was ~400 % greater than pre-disturbance AGBI. Growth of suppressed trees, independent of their age, followed similar trajectories after canopy accession. While aboveground biomass generally increased through time, the time since disturbance and disturbance severity are important co-predictors for stand-level AGBI and AGB. These forests regained most of the above ground living biomass over short interval (~50 years) after low intensity disturbances.
The highest stand-level living AGB was observed on plots that experienced >40% canopy removal 160–190 years ago, whereas the highest AGBI occurred in plots disturbed recently within the past 40–50 years. Our results emphasize the importance of including both individual tree age and disturbance legacies to accurately characterize biomass dynamics and trajectories in forest ecosystems. Importantly, the period of time that a tree is in the canopy, and not tree age, modulates the trajectory of tree level AGBI. Growth rates begin to decline after ~30 years (tree-rings width) and ~100 years (AGBI) in the canopy. We demonstrate that even late-seral forests can rapidly regain biomass lost to low intensity disturbance.
Description of attachments: On the first picture you can see geographical location and period of occurrence of maximum disturbance severity (colour gradient) of the 96 study plots (0.1 ha each). The reconstructed disturbance history is based on the growth pattern of 23–25 randomly selected trees per plot. (For interpretation of the references to colour in this figure legend, the reader is referred to the web version of this article.) Source of digital elevation model: http://www.reverb.echo.nasa.gov; country boundaries: http://www.diva-gis.org. Updated from Trotsiuk et al. (2014).
The second one shows tree-level aboveground biomass increment (AGBI)andring-width increment (TRW)in relation to age (a,c) and time since main canopy accession event. (b, d). All trees were grouped based on the duration of suppression period into 10 years step classes (colour gradient) and the average chronology was truncated when the sample depth drops below 15 individuals. Trees show similar growth trends in both AGBI and tree-ring increment after main canopy accession event (b, d). Dashed lines (c) were fitted to the TRW values shortly before and after the canopy accession event from each curve, and show a steady potential for growth increase over tree age. (For interpretation of the references to colour in this figure legend, the reader is referred to the web version of this article.)
Article 1/1
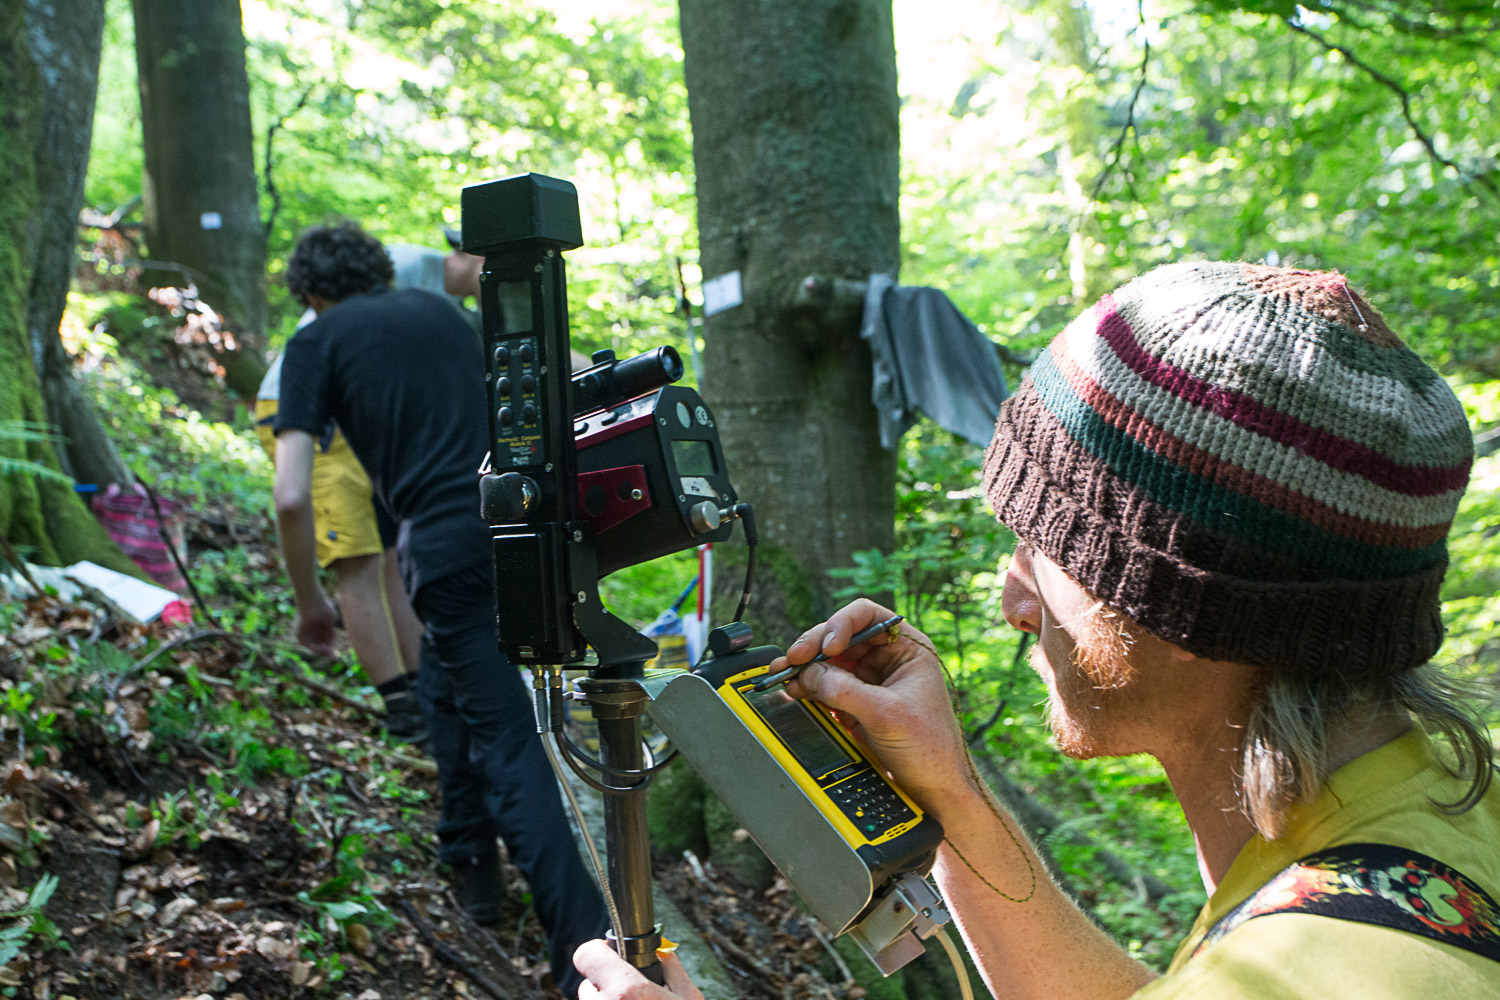
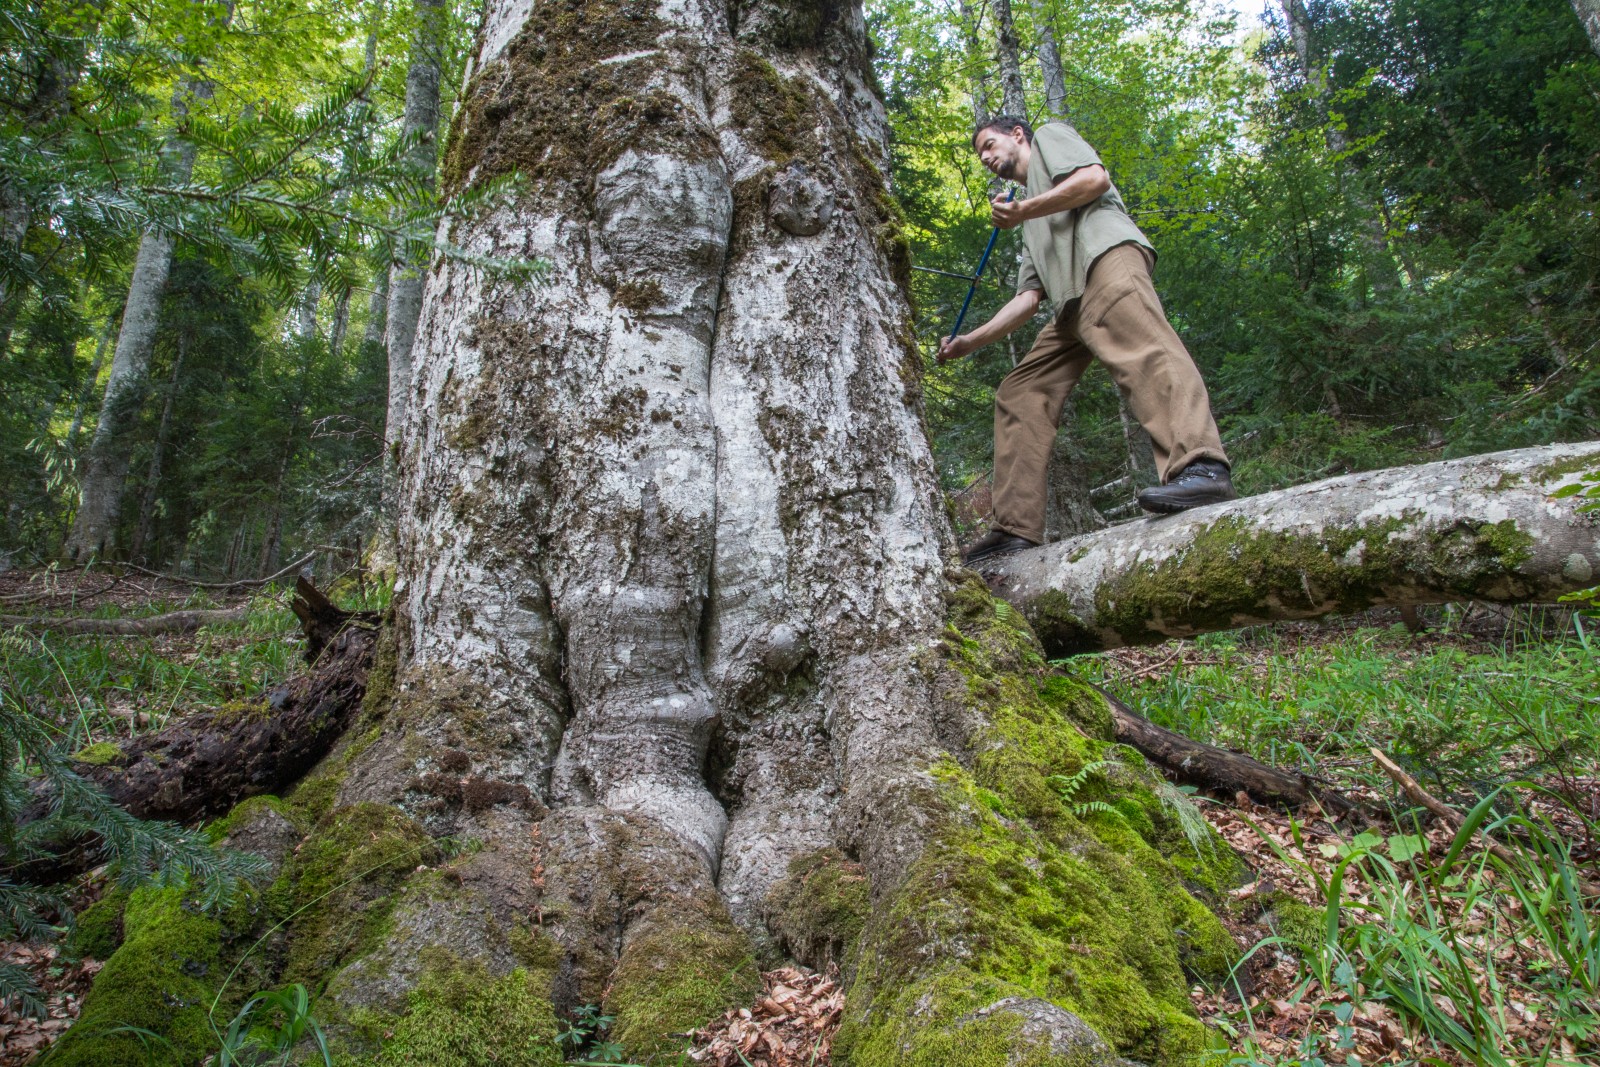
Field and laboratory work
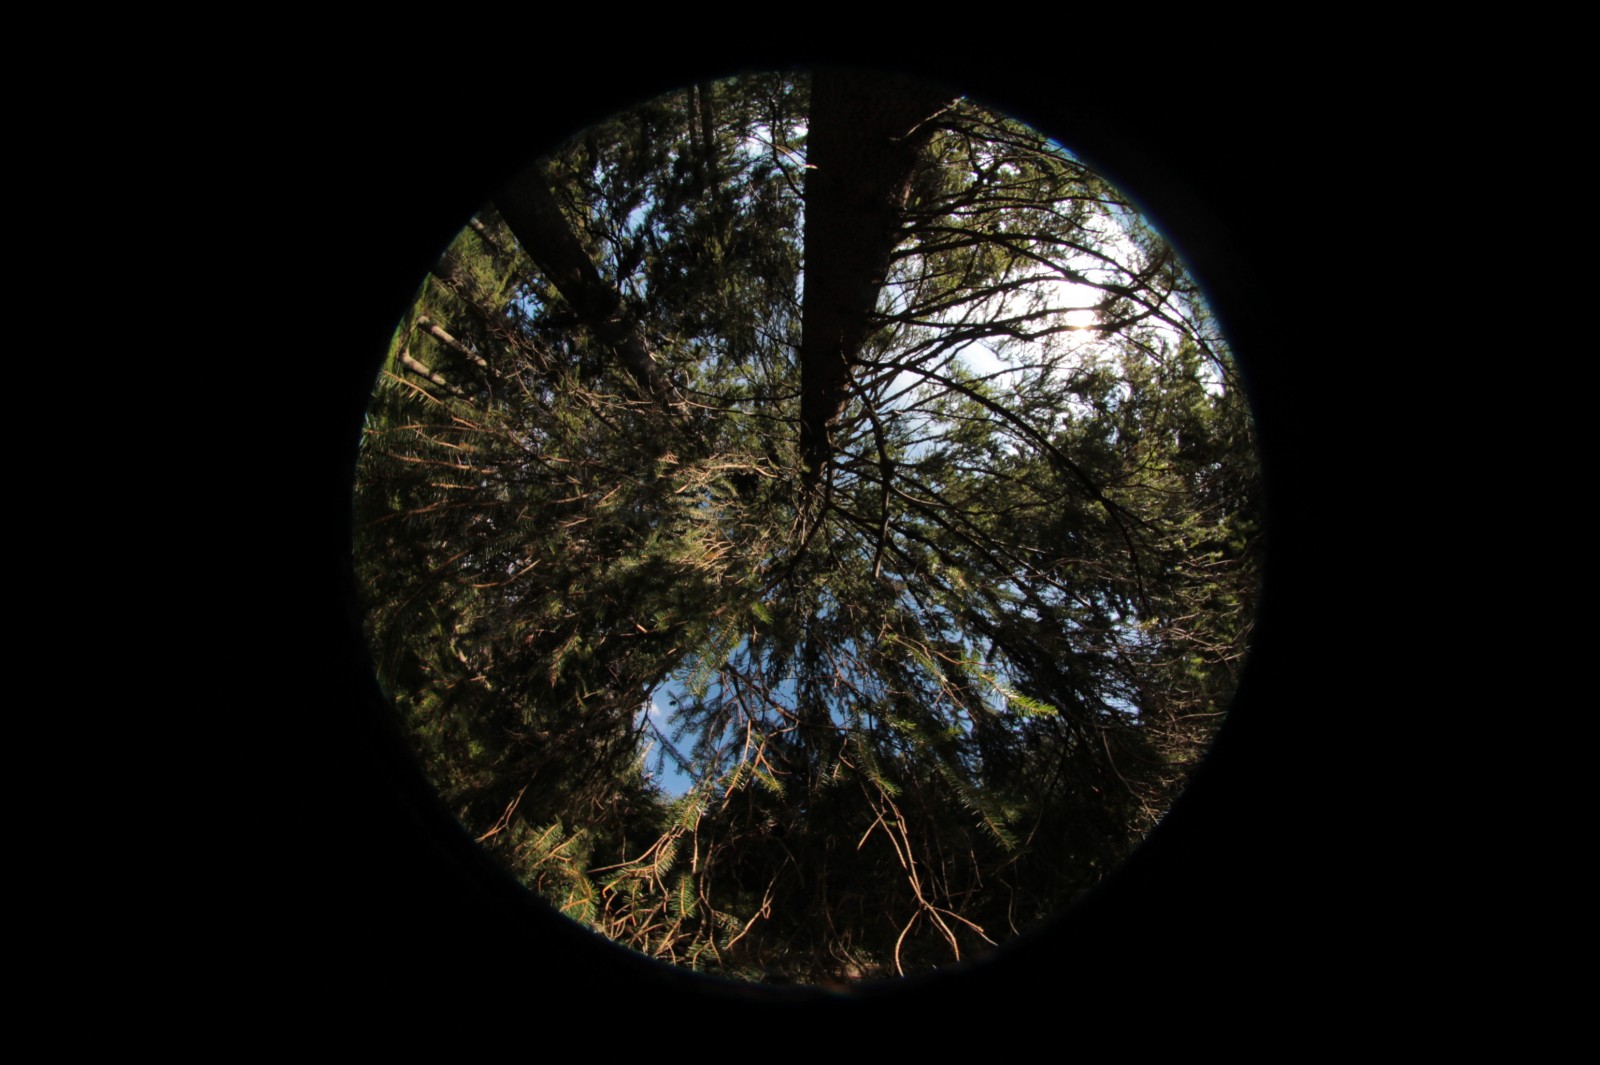
The cornerstones of our work are the samples for dendroecological analyses and the associated information on the structural parameters of the stands obtained from the research areas. The structural data, which includes aspects such as the height and width of trees, the amount of dead wood, and light conditions, are recorded at specific localities during regular field trips. We also investigate microsites that emerge in different forms on old or dying trees, which are important for many kinds of mammals, birds, and insects. Samples of tree growth rings are extracted using special wood drills (increment borer). These samples enable us to look at their development throughout their lives. The width of the growth rings indicates the conditions under which these forests have developed and so it is possible to predict how they will react to prospective climatic changes in the future. The history of the trees hidden in the growth rings reveals when and what types of disturbances they faced. Our growth ring series database, which includes more than thirty-five thousand tree core samples, demonstrates that these disturbances form a natural part of the forest development cycle.
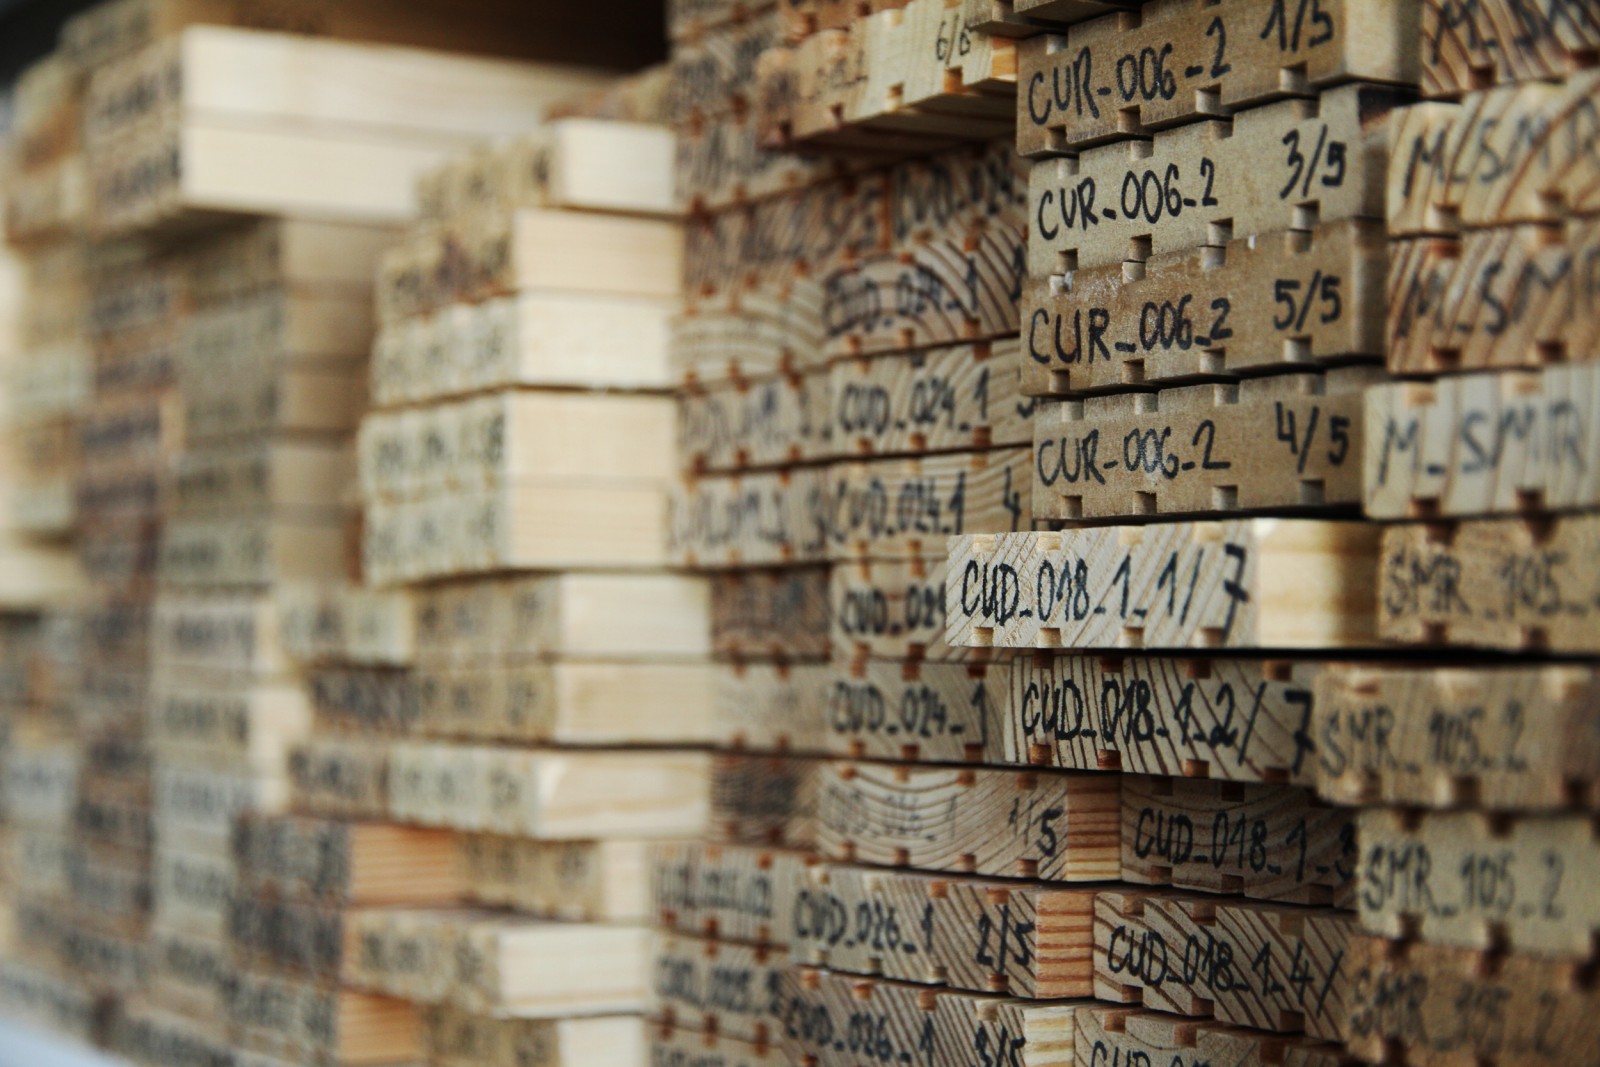
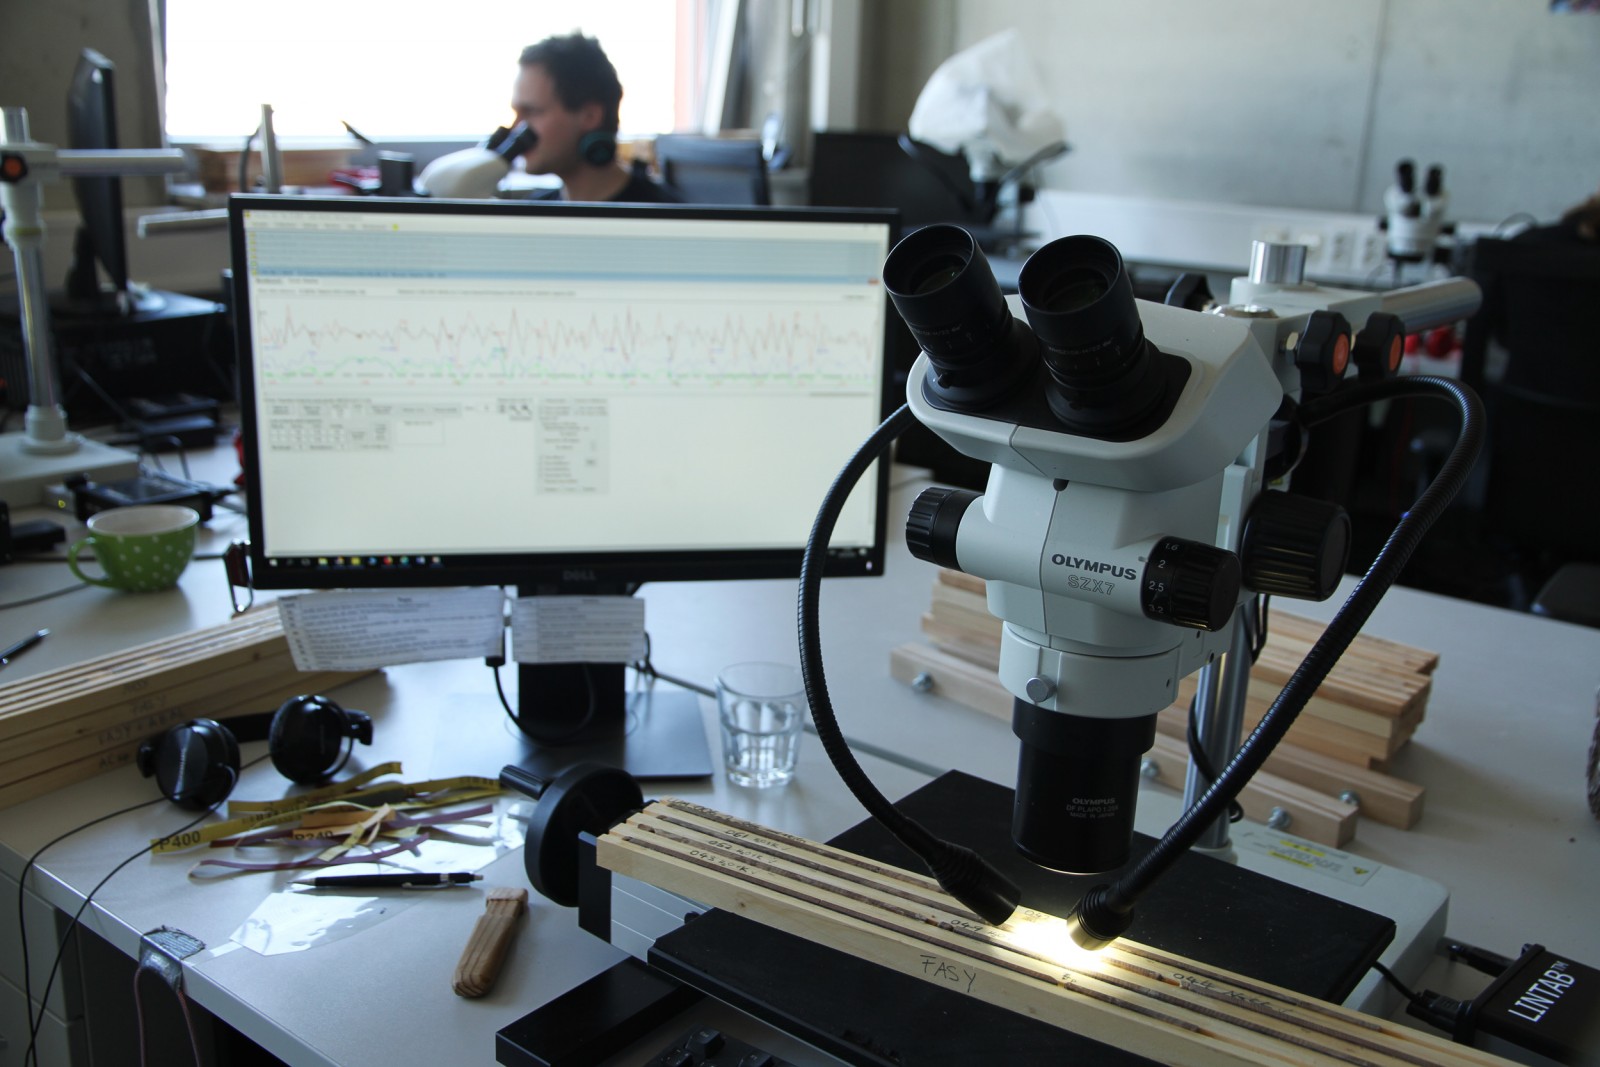
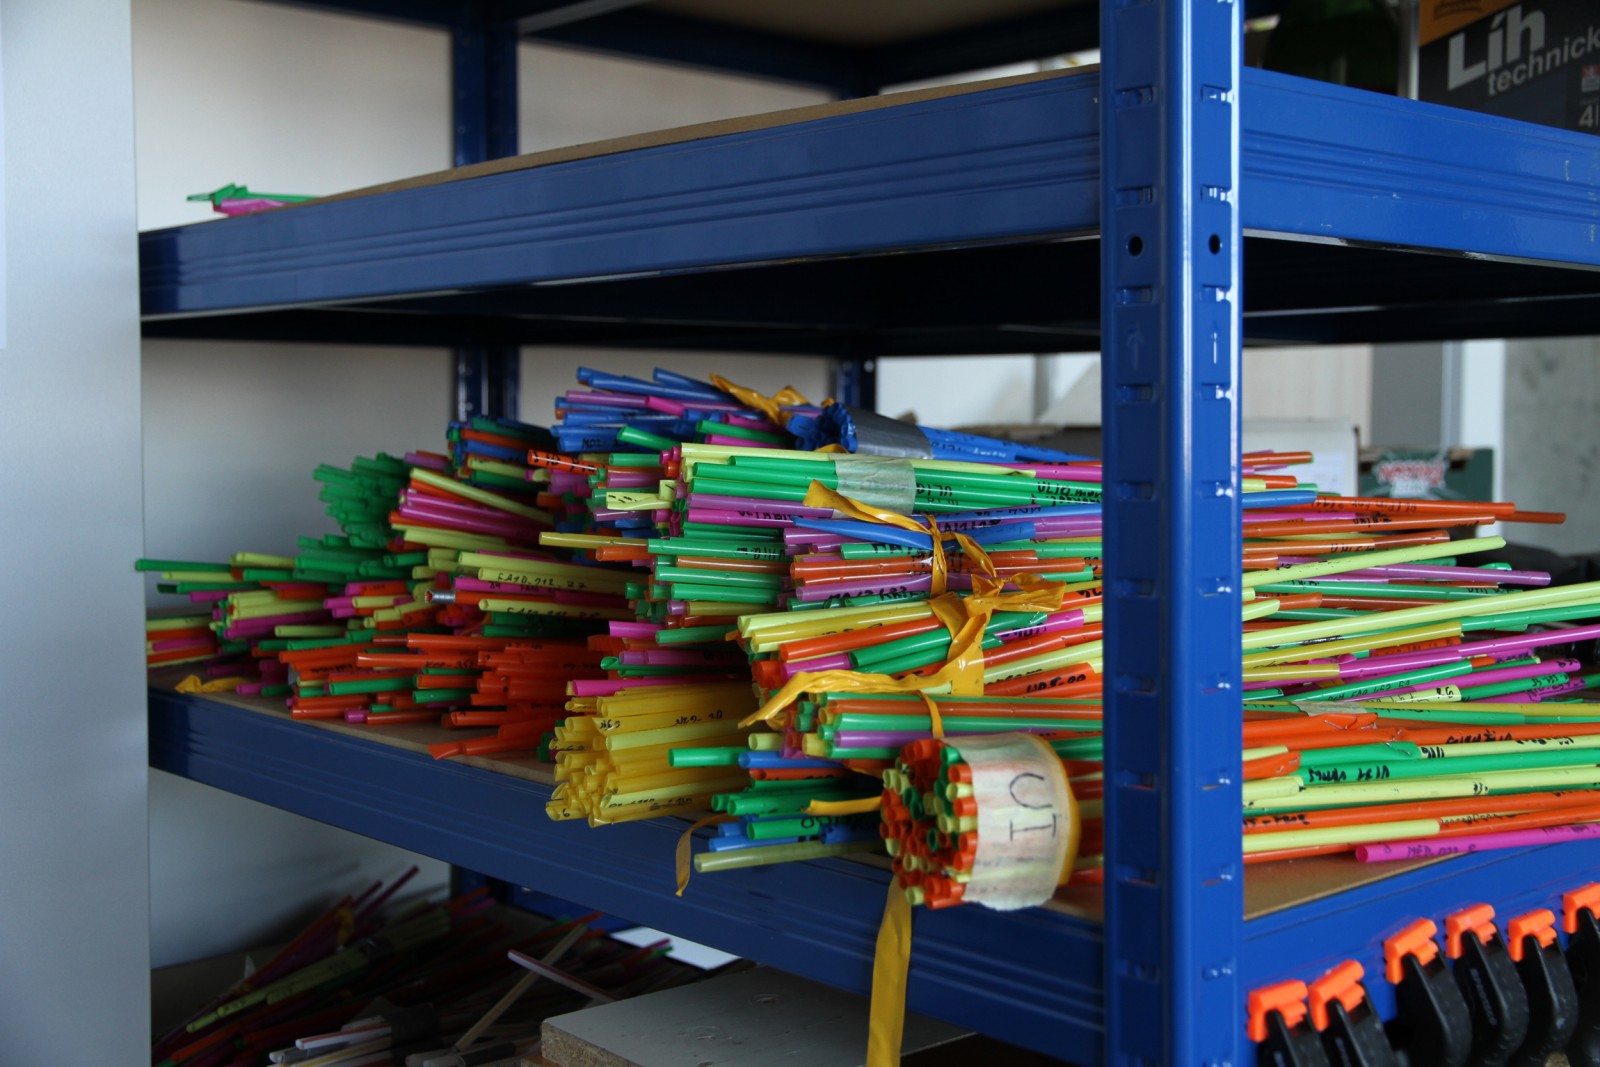
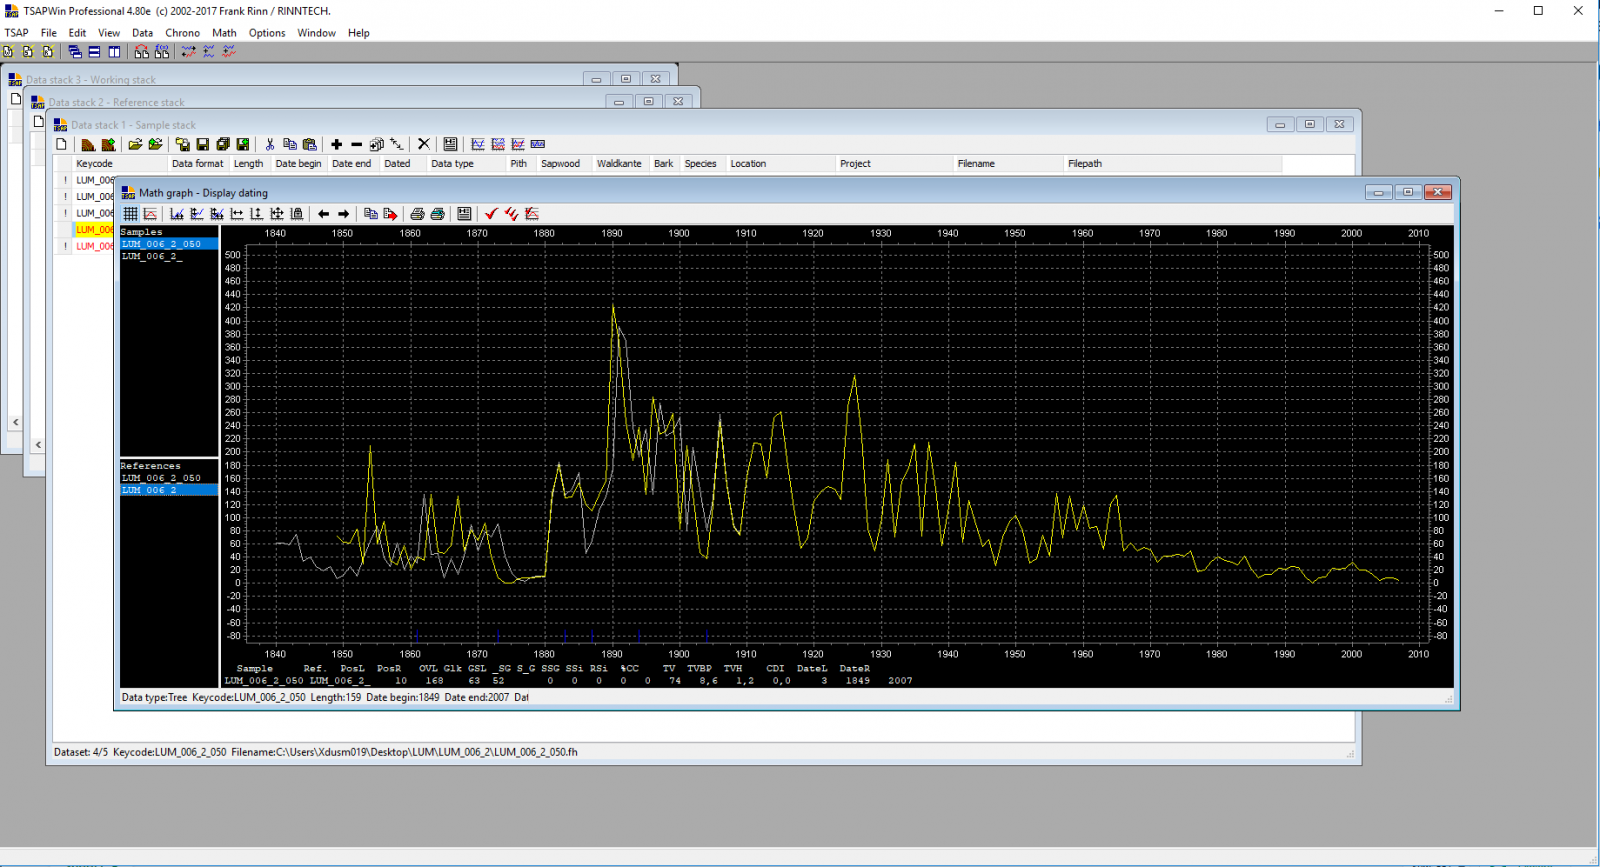
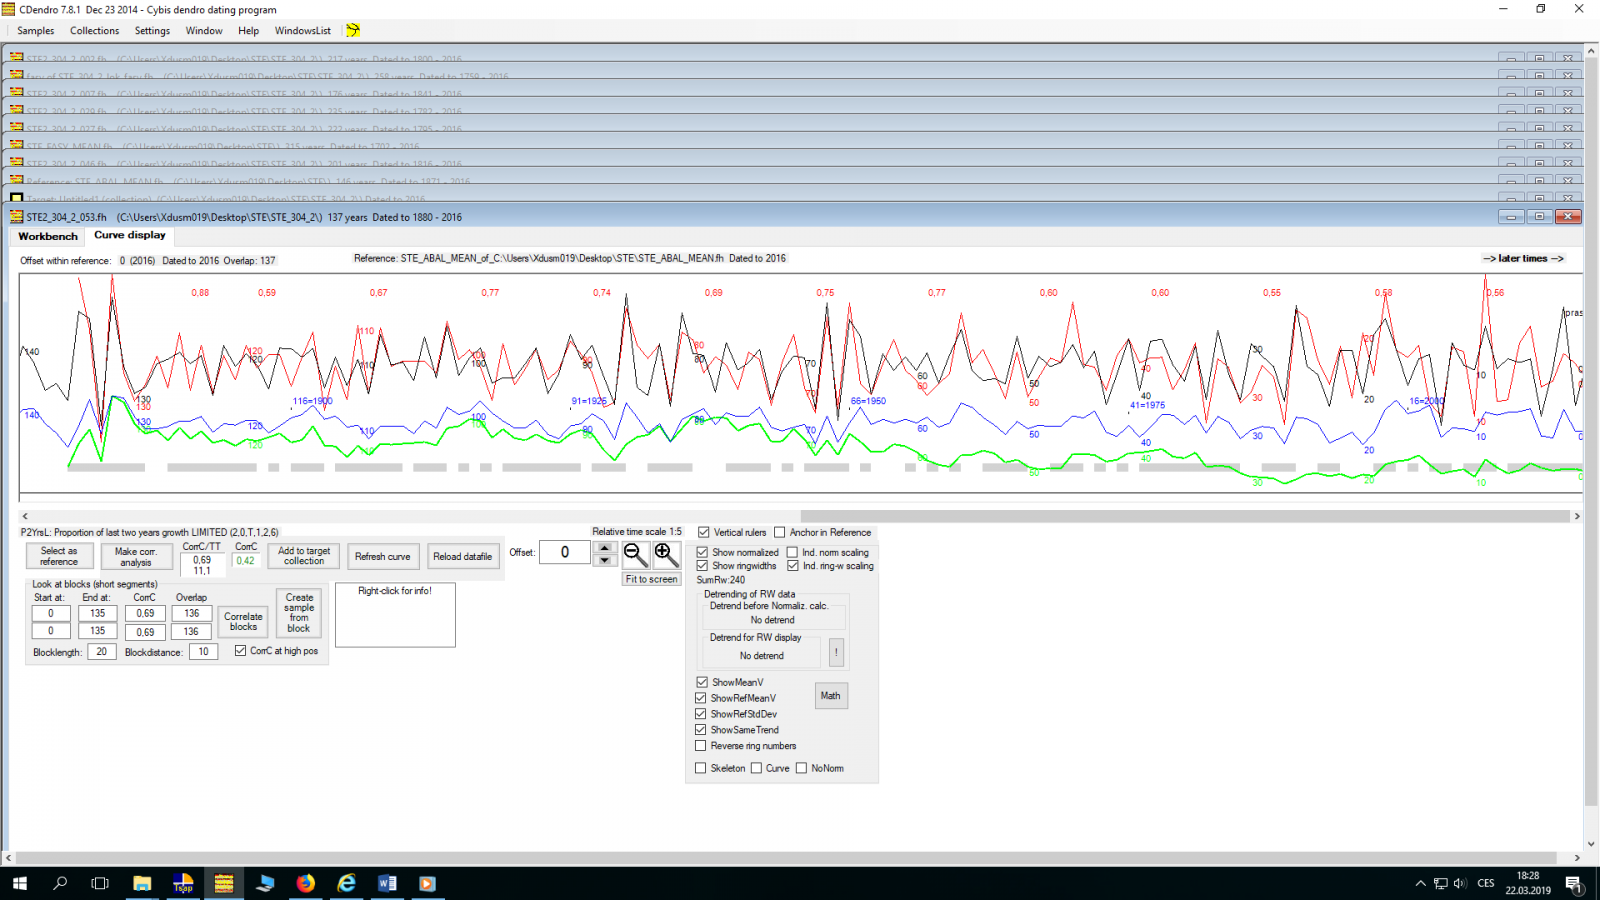
The tree core samples are transferred in protective cases (straws) from the field to a dendrochronological laboratory equipped for their complex processing and analysis. An increment borer leaves a hole in the tree while extracting a wooden core that contains a cross-section of growth rings from the bark to the centre of the tree ideally. The cores are removed from the protective straws and glued to specially made grooved boards, and they can then be sanded with a belt sander to create a clean, smooth surface so the individual cells can be examined. Afterward, tree ring features can be measured by professionals using a set-up that consists of a microscope, a LinTab measurement table, and TSAPWin and CDendro computer programmes, which provide information about the width of consecutive tree growth rings.
The two main reasons for variability in the size of the growth rings of trees of the same species are its position within the forest canopy and the weather over the course of the year. The position of the tree influences the amount of light falling on its crown: a shaded tree grows significantly slower than a dominant one, which affects the long-term average growth rates. In contrast, the weather causes a characteristic year-to-year oscillation observable in the measurements, which allows for accurate cross-dating of multiple trees to ensure tree rings are accurately assigned to the correct years. The weather manifests itself on a regional scale, thus there are smaller growth rings in all the trees in the area during drier or colder years; these minimums are called significant years. The most perennial year in the Carpathian localities is 1952, which indicates very low growth across the region due to a severe drought. The consistency of such trends, however, applies to other years as well, and by correlating growth patterns with other trees from the region, we can better understand climatic variables and monitor other trees.
From a growth perspective, individual woody plants behave differently. Conifers tend to be easily readable without significant year-to-year oscillations. Very rarely are the growth rings actually missing in spruces, but these trees can be difficult to correlate with average growth curves in many localities. Firs, however, tend to correlate very well in such situations, yet it is not unusual to observe 20 or more missing growth rings from suppression periods. Beeches are often among the hardest species to measure and date correctly; they can have discreet growth patterns during dry years alongside wide growth rings, and during periods of suppression, the cells of the summer wood merge into wider rows undifferentiated from spring wood. Therefore, the skills of a worker are essential for high quality results require proper training and skill for technicians making the measurements. Maples are easy to measure, but they are often “moody“, which means that even in a barely imperceptible suppression period there can be many years missing. Within cross-dating, we assess the level of certainty and conclusiveness of the results and exclude disputable cases from further analyses. Extensive experience from a unique dataset allows us to develop unique and innovative methods and to take full advantage of the potential of the data obtained in the field.